Because
r is significant and the scatter plot shows a linear trend, the regression line can be used to predict final exam scores.
Method 2: using a table of critical values to make a decision
The
95% Critical Values of the Sample Correlation Coefficient Table can be used to give you a good idea of whether the computed value of
is significant or not . Compare
r to the appropriate critical value in the table. If
r is not between the positive and negative critical values, then the correlation coefficient is significant. If
r is significant, then you may want to use the line for prediction.
Suppose you computed
r = 0.801 using
n = 10 data points.
df =
n - 2 = 10 - 2 = 8. The critical values associated with
df = 8 are -0.632 and + 0.632. If
r <negative critical value or
r >positive critical value, then
r issignificant. Since
r = 0.801 and 0.801>0.632,
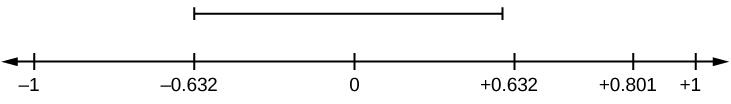
r is significant and the line may be usedfor prediction. If you view this example on a number line, it will help you.
r is not significant between -0.632 and +0.632.
r = 0.801>+0.632. Therefore,
r is significant.
For a given line of best fit, you computed that
r = 0.6501 using
n = 12 data points and the critical value is 0.576. Can the line be used for prediction? Why or why not?
If the scatter plot looks linear then, yes, the line can be used for prediction, because
r >the positive critical value.
Suppose you computed
r = –0.624 with 14 data points.
df = 14 – 2 = 12. The critical values are –0.532 and 0.532. Since –0.624<–0.532,
r is significant and the line can be used for prediction
For a given line of best fit, you compute that
r = 0.5204 using
n = 9 data points, and the critical value is 0.666. Can the line be used for prediction? Why or why not?
No, the line cannot be used for prediction, because
r <the positive critical value.
Suppose you computed
r = 0.776 and
n = 6.
df = 6 – 2 = 4. The critical values are –0.811 and 0.811. Since –0.811<0.776<0.811,
r is not significant, and the line should not be used for prediction.
-0.811<
r = 0.776<0.811. Therefore,
r is not significant.
For a given line of best fit, you compute that
r = –0.7204 using
n = 8 data points, and the critical value is = 0.707. Can the line be used for prediction? Why or why not?
Yes, the line can be used for prediction, because r<the negative critical value.
Third-exam vs final-exam example: critical value method
Consider the
third exam/final exam example .
The line of best fit is:
ŷ = –173.51+4.83
x with
r = 0.6631 and there are
n = 11 data points. Can the regression line be used for prediction?
Given a third-exam score (
x value), can we use the line to predict the final exam score (predicted
y value)?
H
0 :
ρ = 0
H
a :
ρ ≠ 0
α = 0.05
Use the "95% Critical Value" table for
r with
df =
n – 2 = 11 – 2 = 9.
The critical values are –0.602 and +0.602
Since 0.6631>0.602,
r is significant.
Decision: Reject the null hypothesis.
Conclusion:There is sufficient evidence to conclude that there is a significant linear relationship between the third exam score (
x ) and the final exam score (
y ) because the correlation coefficient is significantly different from zero.
Bacteria doesn't produce energy they are dependent upon their substrate in case of lack of nutrients they are able to make spores which helps them to sustain in harsh environments
_Adnan
But not all bacteria make spores, l mean Eukaryotic cells have Mitochondria which acts as powerhouse for them, since bacteria don't have it, what is the substitution for it?
Assimilatory nitrate reduction is a process that occurs in some microorganisms, such as bacteria and archaea, in which nitrate (NO3-) is reduced to nitrite (NO2-), and then further reduced to ammonia (NH3).
Elkana
This process is called assimilatory nitrate reduction because the nitrogen that is produced is incorporated in the cells of microorganisms where it can be used in the synthesis of amino acids and other nitrogen products
There are nothing like emergency disease but there are some common medical emergency which can occur simultaneously like Bleeding,heart attack,Breathing difficulties,severe pain heart stock.Hope you will get my point .Have a nice day ❣️
_Adnan
define infection ,prevention and control
Innocent
I think infection prevention and control is the avoidance of all things we do that gives out break of infections and promotion of health practices that promote life