<< Chapter < Page Chapter >> Page >

It is important that the "standard deviation" used must be appropriate for the parameter we are estimating, so in this section we need to use the standard deviation that applies to sample means, which is σ n . The fraction σ n , is commonly called the "standard error of the mean" in order to distinguish clearly the standard deviation for a mean from the population standard deviation σ .

    In summary, as a result of the central limit theorem:

  • X ¯ is normally distributed, that is, X ¯ ~ N ( μ X , σ n ) .
  • When the population standard deviation σ is known, we use a normal distribution to calculate the error bound.

Calculating the confidence interval

To construct a confidence interval estimate for an unknown population mean, we need data from a random sample. The steps to construct and interpret the confidence interval are:

  • Calculate the sample mean x ¯ from the sample data. Remember, in this section we already know the population standard deviation σ .
  • Find the z -score that corresponds to the confidence level.
  • Calculate the error bound EBM .
  • Construct the confidence interval.
  • Write a sentence that interprets the estimate in the context of the situation in the problem. (Explain what the confidence interval means, in the words of the problem.)

We will first examine each step in more detail, and then illustrate the process with some examples.

Finding the z -score for the stated confidence level

When we know the population standard deviation σ , we use a standard normal distribution to calculate the error bound EBM and construct the confidence interval. We need to find the value of z that puts an area equal to the confidence level (in decimal form) in the middle of the standard normal distribution Z ~ N (0, 1).

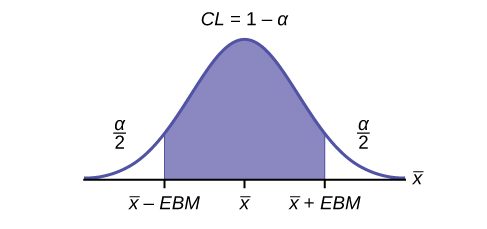
The confidence level, CL , is the area in the middle of the standard normal distribution. CL = 1 – α , so α is the area that is split equally between the two tails. Each of the tails contains an area equal to α 2 .

The z-score that has an area to the right of α 2 is denoted by z α 2 .

For example, when CL = 0.95, α = 0.05 and α 2 = 0.025; we write z α 2 = z 0.025 .

The area to the right of z 0.025 is 0.025 and the area to the left of z 0.025 is 1 – 0.025 = 0.975.

z α 2  =  z 0. 025  = 1 .96 , using a calculator, computer or a standard normal probability table.

invNorm (0.975, 0, 1) = 1.96

Note

Remember to use the area to the LEFT of z α 2 ; in this chapter the last two inputs in the invNorm command are 0, 1, because you are using a standard normal distribution Z ~ N (0, 1).

Calculating the error bound ( EBM )

The error bound formula for an unknown population mean μ when the population standard deviation σ is known is

  • EBM = ( z α 2 ) ( σ n )

Constructing the confidence interval

  • The confidence interval estimate has the format ( x ¯ E B M , x ¯ + E B M ) .

The graph gives a picture of the entire situation.

CL + α 2 + α 2 = CL + α = 1.

This is a normal distribution curve. The peak of the curve coincides with the point x-bar on the horizontal axis. The points x-bar - EBM and x-bar + EBM are labeled on the axis. Vertical lines are drawn from these points to the curve, and the region between the lines is shaded. The shaded region has area equal to 1 - a and represents the confidence level. Each unshaded tail has area a/2.

Writing the interpretation

The interpretation should clearly state the confidence level ( CL ), explain what population parameter is being estimated (here, a population mean ), and state the confidence interval (both endpoints). "We estimate with ___% confidence that the true population mean (include the context of the problem) is between ___ and ___ (include appropriate units)."

Questions & Answers

Ayele, K., 2003. Introductory Economics, 3rd ed., Addis Ababa.
Widad Reply
can you send the book attached ?
Ariel
?
Ariel
What is economics
Widad Reply
the study of how humans make choices under conditions of scarcity
AI-Robot
U(x,y) = (x×y)1/2 find mu of x for y
Desalegn Reply
U(x,y) = (x×y)1/2 find mu of x for y
Desalegn
what is ecnomics
Jan Reply
this is the study of how the society manages it's scarce resources
Belonwu
what is macroeconomic
John Reply
macroeconomic is the branch of economics which studies actions, scale, activities and behaviour of the aggregate economy as a whole.
husaini
etc
husaini
difference between firm and industry
husaini Reply
what's the difference between a firm and an industry
Abdul
firm is the unit which transform inputs to output where as industry contain combination of firms with similar production 😅😅
Abdulraufu
Suppose the demand function that a firm faces shifted from Qd  120 3P to Qd  90  3P and the supply function has shifted from QS  20  2P to QS 10  2P . a) Find the effect of this change on price and quantity. b) Which of the changes in demand and supply is higher?
Toofiq Reply
explain standard reason why economic is a science
innocent Reply
factors influencing supply
Petrus Reply
what is economic.
Milan Reply
scares means__________________ends resources. unlimited
Jan
economics is a science that studies human behaviour as a relationship b/w ends and scares means which have alternative uses
Jan
calculate the profit maximizing for demand and supply
Zarshad Reply
Why qualify 28 supplies
Milan
what are explicit costs
Nomsa Reply
out-of-pocket costs for a firm, for example, payments for wages and salaries, rent, or materials
AI-Robot
concepts of supply in microeconomics
David Reply
economic overview notes
Amahle Reply
identify a demand and a supply curve
Salome Reply
i don't know
Parul
there's a difference
Aryan
Demand curve shows that how supply and others conditions affect on demand of a particular thing and what percent demand increase whith increase of supply of goods
Israr
Hi Sir please how do u calculate Cross elastic demand and income elastic demand?
Abari
Got questions? Join the online conversation and get instant answers!
Jobilize.com Reply

Get Jobilize Job Search Mobile App in your pocket Now!

Get it on Google Play Download on the App Store Now


Source:  OpenStax, Introductory statistics. OpenStax CNX. May 06, 2016 Download for free at http://legacy.cnx.org/content/col11562/1.18
Google Play and the Google Play logo are trademarks of Google Inc.

Notification Switch

Would you like to follow the 'Introductory statistics' conversation and receive update notifications?

Ask