<< Chapter < Page Chapter >> Page >

General form of a confidence interval

(lower value, upper value) = (point estimate−error bound, point estimate + error bound)

To find the error bound when you know the confidence interval

error bound = upper value−point estimate OR error bound = upper value lower value 2

Single Population Mean, Known Standard Deviation, Normal Distribution

Use the Normal Distribution for Means, Population Standard Deviation is Known EBM = z α 2 σ n

The confidence interval has the format ( x ¯ EBM , x ¯ + EBM ).

Use the following information to answer the next five exercises: The standard deviation of the weights of elephants is known to be approximately 15 pounds. We wish to construct a 95% confidence interval for the mean weight of newborn elephant calves. Fifty newborn elephants are weighed. The sample mean is 244 pounds. The sample standard deviation is 11 pounds.

Identify the following:

  1. x ¯ = _____
  2. σ = _____
  3. n = _____
  1. 244
  2. 15
  3. 50
Got questions? Get instant answers now!

In words, define the random variables X and X ¯ .

Got questions? Get instant answers now!

Which distribution should you use for this problem?

N ( 244 , 15 50 )

Got questions? Get instant answers now!

Construct a 95% confidence interval for the population mean weight of newborn elephants. State the confidence interval, sketch the graph, and calculate the error bound.

Got questions? Get instant answers now!

What will happen to the confidence interval obtained, if 500 newborn elephants are weighed instead of 50? Why?

As the sample size increases, there will be less variability in the mean, so the interval size decreases.

Got questions? Get instant answers now!


Use the following information to answer the next seven exercises: The U.S. Census Bureau conducts a study to determine the time needed to complete the short form. The Bureau surveys 200 people. The sample mean is 8.2 minutes. There is a known standard deviation of 2.2 minutes. The population distribution is assumed to be normal.

Identify the following:

  1. x ¯ = _____
  2. σ = _____
  3. n = _____
Got questions? Get instant answers now!

In words, define the random variables X and X ¯ .

X is the time in minutes it takes to complete the U.S. Census short form. X ¯ is the mean time it took a sample of 200 people to complete the U.S. Census short form.

Got questions? Get instant answers now!

Which distribution should you use for this problem?

Got questions? Get instant answers now!

Construct a 90% confidence interval for the population mean time to complete the forms. State the confidence interval, sketch the graph, and calculate the error bound.

CI: (7.9441, 8.4559)
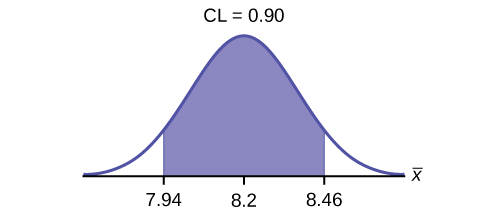
This is a normal distribution curve. The peak of the curve coincides with the point 8.2 on the horizontal axis.  A central region is shaded between points 7.94 and 8.46.

EBM = 0.26

Got questions? Get instant answers now!

If the Census wants to increase its level of confidence and keep the error bound the same by taking another survey, what changes should it make?

Got questions? Get instant answers now!

If the Census did another survey, kept the error bound the same, and surveyed only 50 people instead of 200, what would happen to the level of confidence? Why?

The level of confidence would decrease because decreasing n makes the confidence interval wider, so at the same error bound, the confidence level decreases.

Got questions? Get instant answers now!

Suppose the Census needed to be 98% confident of the population mean length of time. Would the Census have to survey more people? Why or why not?

Got questions? Get instant answers now!


Use the following information to answer the next ten exercises: A sample of 20 heads of lettuce was selected. Assume that the population distribution of head weight is normal. The weight of each head of lettuce was then recorded. The mean weight was 2.2 pounds with a standard deviation of 0.1 pounds. The population standard deviation is known to be 0.2 pounds.

Questions & Answers

how do you get the 2/50
Abba Reply
number of sport play by 50 student construct discrete data
Aminu Reply
width of the frangebany leaves on how to write a introduction
Theresa Reply
Solve the mean of variance
Veronica Reply
Step 1: Find the mean. To find the mean, add up all the scores, then divide them by the number of scores. ... Step 2: Find each score's deviation from the mean. ... Step 3: Square each deviation from the mean. ... Step 4: Find the sum of squares. ... Step 5: Divide the sum of squares by n – 1 or N.
kenneth
what is error
Yakuba Reply
Is mistake done to something
Vutshila
Hy
anas
hy
What is the life teble
anas
hy
Jibrin
statistics is the analyzing of data
Tajudeen Reply
what is statics?
Zelalem Reply
how do you calculate mean
Gloria Reply
diveving the sum if all values
Shaynaynay
let A1,A2 and A3 events be independent,show that (A1)^c, (A2)^c and (A3)^c are independent?
Fisaye Reply
what is statistics
Akhisani Reply
data collected all over the world
Shaynaynay
construct a less than and more than table
Imad Reply
The sample of 16 students is taken. The average age in the sample was 22 years with astandard deviation of 6 years. Construct a 95% confidence interval for the age of the population.
Aschalew Reply
Bhartdarshan' is an internet-based travel agency wherein customer can see videos of the cities they plant to visit. The number of hits daily is a normally distributed random variable with a mean of 10,000 and a standard deviation of 2,400 a. what is the probability of getting more than 12,000 hits? b. what is the probability of getting fewer than 9,000 hits?
Akshay Reply
Bhartdarshan'is an internet-based travel agency wherein customer can see videos of the cities they plan to visit. The number of hits daily is a normally distributed random variable with a mean of 10,000 and a standard deviation of 2,400. a. What is the probability of getting more than 12,000 hits
Akshay
1
Bright
Sorry i want to learn more about this question
Bright
Someone help
Bright
a= 0.20233 b=0.3384
Sufiyan
a
Shaynaynay
How do I interpret level of significance?
Mohd Reply
It depends on your business problem or in Machine Learning you could use ROC- AUC cruve to decide the threshold value
Shivam
how skewness and kurtosis are used in statistics
Owen Reply
yes what is it
Taneeya

Get Jobilize Job Search Mobile App in your pocket Now!

Get it on Google Play Download on the App Store Now


Source:  OpenStax, Introductory statistics. OpenStax CNX. May 06, 2016 Download for free at http://legacy.cnx.org/content/col11562/1.18
Google Play and the Google Play logo are trademarks of Google Inc.

Notification Switch

Would you like to follow the 'Introductory statistics' conversation and receive update notifications?

Ask