<< Chapter < Page Chapter >> Page >
This module introduces the continuous probability function and explores the relationship between the probability of X and the area under the curve of f(X).

We begin by defining a continuous probability density function. We use the function notation f x . Intermediate algebra may have been your first formal introduction to functions. In the study of probability, the functions we study are special. We define the function f x so that the area between it and the x-axis is equal to a probability. Since the maximum probability is one,the maximum area is also one.

For continuous probability distributions, PROBABILITY = AREA.

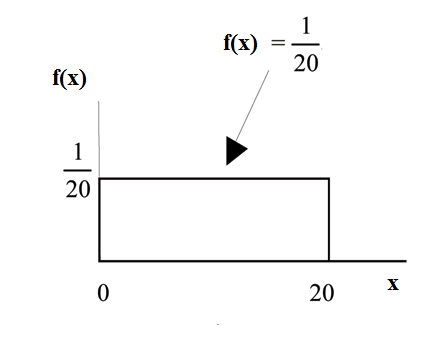
Consider the function f x = 1 20 for 0 x 20 . x = a real number. The graph of f x = 1 20 is a horizontal line. However, since 0 x 20 , f x is restricted to the portion between x 0 and x 20 , inclusive .

f(x)=1/20 graph displaying a boxed region consisting of a horizontal line extending to the right from point 1/20 on the y-axis, a vertical upward line from point 20 on the x-axis, and the x and y-axes.

f x = 1 20 for 0 x 20 .

The graph of f x = 1 20 isa horizontal line segment when 0 x 20 .

The area between f x = 1 20 where 0 x 20 and the x-axis is the area of a rectangle with base = 20 and height = 1 20 .

AREA 20 1 20 1

This particular function, where we have restricted x so that the area between the function and the x-axis is 1, is an example of a continuousprobability density function. It is used as a tool to calculate probabilities.

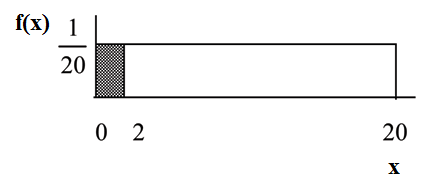
Suppose we want to find the area between f x = 1 20 and the x-axis where 0 x 2 .

f(X)=1/20 graph displaying a boxed region consisting of a horizontal line extending to the right from point 1/20 on the y-axis, a vertical upward line from point 20 on the x-axis, and the x and y-axes. A shaded region ranging from points 0-2 on the x-axis occurs within this area.

AREA ( 2 - 0 ) 1 20 0.1

( 2 - 0 ) 2 base of a rectangle

1 20 = the height.

The area corresponds to a probability. The probability that x is between 0 and 2 is 0.1, which can be written mathematically as P(0<x<2) = P(x<2) = 0.1 .

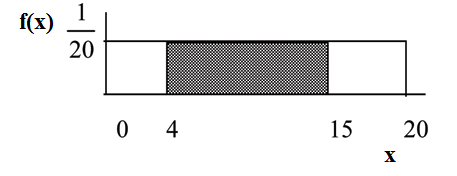
Suppose we want to find the area between f x = 1 20 and the x-axis where 4 x 15 .

f(X)=1/20 graph displaying a boxed region consisting of a horizontal line extending to the right from point 1/20 on the y-axis, a vertical upward line from point 20 on the x-axis, and the x and y-axes. A shaded region ranging from points 4-15 on the x-axis occurs within this area.

AREA ( 15 - 4 ) 1 20 0.55

( 15 - 4 ) = 11 = the base of a rectangle

1 20 = the height.

The area corresponds to the probability P ( 4 x 15 ) 0.55 .

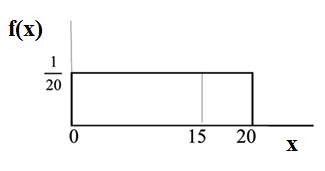
Suppose we want to find P ( x = 15 ) . On an x-y graph, x = 15 is a vertical line. A vertical line has no width (or 0 width). Therefore, P ( x = 15 ) = (base) (height) = ( 0 ) ( 1 20 ) = 0 .

f(X)=1/20 graph displaying a boxed region consisting of a horizontal line extending to the right from point 1/20 on the y-axis, a vertical upward line from point 20 on the x-axis, and the x and y-axes. A vertical upward line is drawn from point 15 on the x-axis to the horizontal line occurring from point 1/20 on the y-axis.

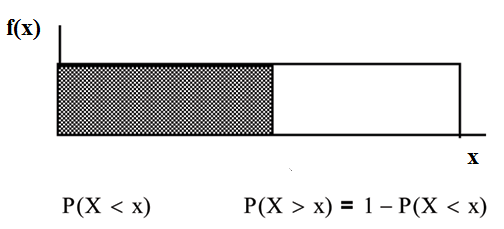
P ( X x ) (can be written as P ( X x ) for continuous distributions) is called the cumulative distribution function or CDF . Notice the "less than or equal to" symbol. We can use the CDF to calculate P ( X x ) . The CDF gives "area to the left" and P ( X x ) gives "area to the right." We calculate P ( X x ) for continuous distributions as follows: P ( X x ) 1 - P ( X x ) .

f(X) graph displaying a boxed region consisting of a horizontal line extending to the right from midway on the y-axis, a vertical upward line from an arbitrary point on the x-axis, and the x and y-axes. A shaded region from points 0-x occurs within this area.

Label the graph with f(x) and x . Scale the x and y axes with the maximum x and y values. f x 1 20 , 0 x 20 .

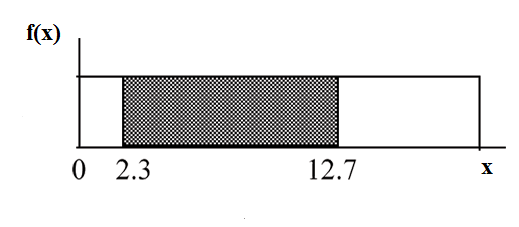
f(X) graph displaying a boxed region consisting of a horizontal line extending to the right from midway on the y-axis, a vertical upward line from an arbitrary point on the x-axis, and the x and y-axes. A shaded region from points 2.3-12.7 occurs within this area.

P ( 2.3 x 12.7 ) ( base ) ( height ) ( 12.7 - 2.3 ) ( 1 20 ) 0.52

Got questions? Get instant answers now!

Questions & Answers

define biology infour way
Happiness Reply
What are types of cell
Nansoh Reply
how can I get this book
Gatyin Reply
what is lump
Chineye Reply
what is cell
Maluak Reply
what is biology
Maluak
what's cornea?
Majak Reply
what are cell
Achol
Explain the following terms . (1) Abiotic factors in an ecosystem
Nomai Reply
Abiotic factors are non living components of ecosystem.These include physical and chemical elements like temperature,light,water,soil,air quality and oxygen etc
Qasim
what is biology
daniel Reply
what is diffusion
Emmanuel Reply
passive process of transport of low-molecular weight material according to its concentration gradient
AI-Robot
what is production?
Catherine
Pathogens and diseases
how did the oxygen help a human being
Achol Reply
how did the nutrition help the plants
Achol Reply
Biology is a branch of Natural science which deals/About living Organism.
Ahmedin Reply
what is phylogeny
Odigie Reply
evolutionary history and relationship of an organism or group of organisms
AI-Robot
ok
Deng
what is biology
Hajah Reply
cell is the smallest unit of the humanity biologically
Abraham
ok
Achol
Got questions? Join the online conversation and get instant answers!
Jobilize.com Reply

Get Jobilize Job Search Mobile App in your pocket Now!

Get it on Google Play Download on the App Store Now


Source:  OpenStax, Collaborative statistics. OpenStax CNX. Jul 03, 2012 Download for free at http://cnx.org/content/col10522/1.40
Google Play and the Google Play logo are trademarks of Google Inc.

Notification Switch

Would you like to follow the 'Collaborative statistics' conversation and receive update notifications?

Ask