

| << Chapter < Page | Chapter >> Page > |
The comparison of two population means is very common. A difference between the two samples depends on both the means and the standard deviations. Very different means can occur by chance if there is great variation among the individual samples. In order to account for the variation, we take the difference of the sample means, – , and divide by the standard error in order to standardize the difference. The result is a t-score test statistic.
Because we do not know the population standard deviations, we estimate them using the two sample standard deviations from our independent samples. For the hypothesis test, we calculate the estimated standard deviation, or standard error , of the difference in sample means , – .
The test statistic ( t -score) is calculated as follows:
The number of degrees of freedom ( df ) requires a somewhat complicated calculation. However, a computer or calculator calculates it easily. The df are not always a whole number. The test statistic calculated previously is approximated by the Student's t -distribution with df as follows:
When both sample sizes n 1 and n 2 are five or larger, the Student's t approximation is very good. Notice that the sample variances ( s 1 ) 2 and ( s 2 ) 2 are not pooled. (If the question comes up, do not pool the variances.)
The average amount of time boys and girls aged seven to 11 spend playing sports each day is believed to be the same. A study is done and data are collected, resulting in the data in [link] . Each populations has a normal distribution.
| Sample Size | Average Number of Hours Playing Sports Per Day | Sample Standard Deviation | |
|---|---|---|---|
| Girls | 9 | 2 | |
| Boys | 16 | 3.2 | 1.00 |
Is there a difference in the mean amount of time boys and girls aged seven to 11 play sports each day? Test at the 5% level of significance.
The population standard deviations are not known. Let g be the subscript for girls and b be the subscript for boys. Then, μ g is the population mean for girls and μ b is the population mean for boys. This is a test of two independent groups , two population means .
Random variable :
= difference in the sample mean amount of time girls and boys play sports each day.
H
0 :
μ
g =
μ
b
H
0 :
μ
g –
μ
b = 0
H
a :
μ
g ≠
μ
b
H
a :
μ
g –
μ
b ≠ 0
The words
"the same" tell you
H
0 has an "=". Since there are no other words to indicate
H
a , assume it says
"is different." This is a two-tailed test.
Distribution for the test: Use t df where df is calculated using the df formula for independent groups, two population means. Using a calculator, df is approximately 18.8462. Do not pool the variances.
Calculate the p -value using a Student's t -distribution: p -value = 0.0054
Graph:
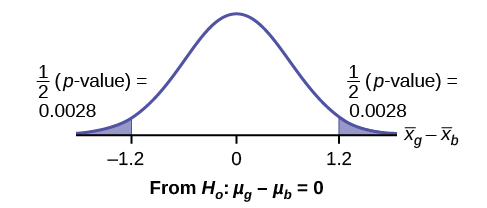
So,
= 2 – 3.2 = –1.2
Half the
p -value is below –1.2 and half is above 1.2.
Make a decision: Since α > p -value, reject H 0 . This means you reject μ g = μ b . The means are different.
Press
STAT . Arrow over to
TESTS and press
4:2-SampTTest . Arrow over to Stats and press
ENTER . Arrow down and enter
2 for the first sample mean,
for Sx1,
9 for n1,
3.2 for the
second sample mean,
1 for Sx2, and
16 for n2. Arrow down to μ1: and arrow to
does not equal μ2. Press
ENTER . Arrow down to Pooled: and
No . Press
ENTER . Arrow down to
Calculate and press
ENTER . The
p -value is
p = 0.0054, the dfs are approximately 18.8462, and the test statistic is -3.14. Do the procedure again but instead of Calculate do Draw.
Conclusion: At the 5% level of significance, the sample data show there is sufficient evidence to conclude that the mean number of hours that girls and boys aged seven to 11 play sports per day is different (mean number of hours boys aged seven to 11 play sports per day is greater than the mean number of hours played by girls OR the mean number of hours girls aged seven to 11 play sports per day is greater than the mean number of hours played by boys).
Notification Switch
Would you like to follow the 'Introductory statistics' conversation and receive update notifications?

|
|

|
|

|
|

|
|

|
|

|
|

|
|

|
|

|
|

|
|

|