<< Chapter < Page Chapter >> Page >

Asian americans

Like many groups this section discusses, Asian Americans represent a great diversity of cultures and backgrounds. The experience of a Japanese American whose family has been in the United States for three generations will be drastically different from a Laotian American who has only been in the United States for a few years. This section primarily discusses Chinese, Japanese, and Vietnamese immigrants and shows the differences between their experiences. The most recent estimate from the U.S. Census Bureau (2014) suggest about 5.3 percent of the population identify themselves as Asian.

How and why they came

The national and ethnic diversity of Asian American immigration history is reflected in the variety of their experiences in joining U.S. society. Asian immigrants have come to the United States in waves, at different times, and for different reasons.

The first Asian immigrants to come to the United States in the mid-nineteenth century were Chinese. These immigrants were primarily men whose intention was to work for several years in order to earn incomes to support their families in China. Their main destination was the American West, where the Gold Rush was drawing people with its lure of abundant money. The construction of the Transcontinental Railroad was underway at this time, and the Central Pacific section hired thousands of migrant Chinese men to complete the laying of rails across the rugged Sierra Nevada mountain range. Chinese men also engaged in other manual labor like mining and agricultural work. The work was grueling and underpaid, but like many immigrants, they persevered.

Japanese immigration began in the 1880s, on the heels of the Chinese Exclusion Act of 1882. Many Japanese immigrants came to Hawaii to participate in the sugar industry; others came to the mainland, especially to California. Unlike the Chinese, however, the Japanese had a strong government that negotiated with the U.S. government to ensure the well-being of their immigrants. Japanese men were able to bring their wives and families to the United States, and were thus able to produce second- and third-generation Japanese Americans more quickly than their Chinese counterparts.

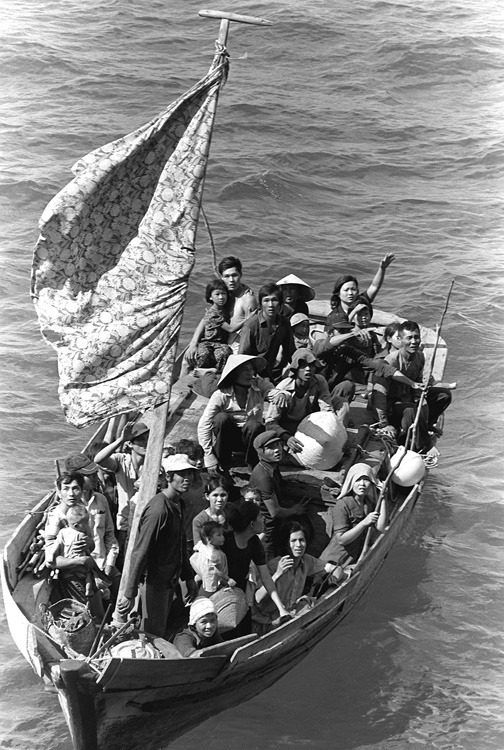
The most recent large-scale Asian immigration came from Korea and Vietnam and largely took place during the second half of the twentieth century. While Korean immigration has been fairly gradual, Vietnamese immigration occurred primarily post-1975, after the fall of Saigon and the establishment of restrictive communist policies in Vietnam. Whereas many Asian immigrants came to the United States to seek better economic opportunities, Vietnamese immigrants came as political refugees, seeking asylum from harsh conditions in their homeland. The Refugee Act of 1980 helped them to find a place to settle in the United States.

A boat containing Vietnamese refugees.
Thirty-five Vietnamese refugees wait to be taken aboard the amphibious USS Blue Ridge (LCC-19) . They are being rescued from a thirty-five-foot fishing boat 350 miles northeast of Cam Ranh Bay, Vietnam, after spending eight days at sea. (Photo courtesy of U.S. Navy/Wikimedia Commons)

Questions & Answers

how do you get the 2/50
Abba Reply
number of sport play by 50 student construct discrete data
Aminu Reply
width of the frangebany leaves on how to write a introduction
Theresa Reply
Solve the mean of variance
Veronica Reply
Step 1: Find the mean. To find the mean, add up all the scores, then divide them by the number of scores. ... Step 2: Find each score's deviation from the mean. ... Step 3: Square each deviation from the mean. ... Step 4: Find the sum of squares. ... Step 5: Divide the sum of squares by n – 1 or N.
kenneth
what is error
Yakuba Reply
Is mistake done to something
Vutshila
Hy
anas
hy
What is the life teble
anas
hy
Jibrin
statistics is the analyzing of data
Tajudeen Reply
what is statics?
Zelalem Reply
how do you calculate mean
Gloria Reply
diveving the sum if all values
Shaynaynay
let A1,A2 and A3 events be independent,show that (A1)^c, (A2)^c and (A3)^c are independent?
Fisaye Reply
what is statistics
Akhisani Reply
data collected all over the world
Shaynaynay
construct a less than and more than table
Imad Reply
The sample of 16 students is taken. The average age in the sample was 22 years with astandard deviation of 6 years. Construct a 95% confidence interval for the age of the population.
Aschalew Reply
Bhartdarshan' is an internet-based travel agency wherein customer can see videos of the cities they plant to visit. The number of hits daily is a normally distributed random variable with a mean of 10,000 and a standard deviation of 2,400 a. what is the probability of getting more than 12,000 hits? b. what is the probability of getting fewer than 9,000 hits?
Akshay Reply
Bhartdarshan'is an internet-based travel agency wherein customer can see videos of the cities they plan to visit. The number of hits daily is a normally distributed random variable with a mean of 10,000 and a standard deviation of 2,400. a. What is the probability of getting more than 12,000 hits
Akshay
1
Bright
Sorry i want to learn more about this question
Bright
Someone help
Bright
a= 0.20233 b=0.3384
Sufiyan
a
Shaynaynay
How do I interpret level of significance?
Mohd Reply
It depends on your business problem or in Machine Learning you could use ROC- AUC cruve to decide the threshold value
Shivam
how skewness and kurtosis are used in statistics
Owen Reply
yes what is it
Taneeya
Got questions? Join the online conversation and get instant answers!
Jobilize.com Reply

Get Jobilize Job Search Mobile App in your pocket Now!

Get it on Google Play Download on the App Store Now


Source:  OpenStax, Introduction to sociology 2e. OpenStax CNX. Jan 20, 2016 Download for free at http://legacy.cnx.org/content/col11762/1.6
Google Play and the Google Play logo are trademarks of Google Inc.

Notification Switch

Would you like to follow the 'Introduction to sociology 2e' conversation and receive update notifications?

Ask