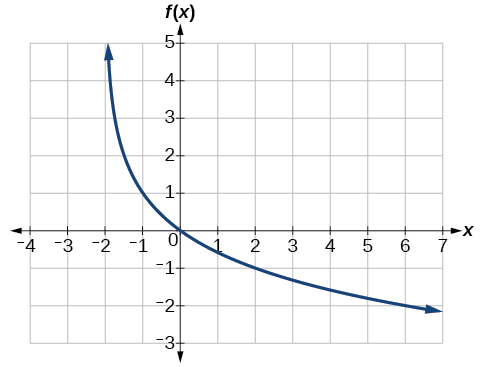
Find a possible equation for the common logarithmic function graphed in
[link] .
This graph has a vertical asymptote at
and has been vertically reflected. We do not know yet the vertical shift or the vertical stretch. We know so far that the equation will have form:
It appears the graph passes through the points
and
Substituting
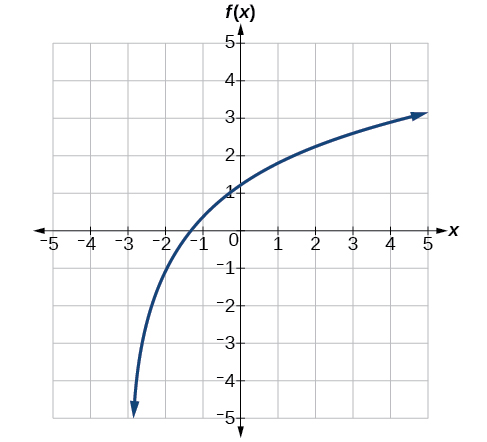
Is it possible to tell the domain and range and describe the end behavior of a function just by looking at the graph?
Yes, if we know the function is a general logarithmic function. For example, look at the graph in
[link] . The graph approaches
(or thereabouts) more and more closely, so
is, or is very close to, the vertical asymptote. It approaches from the right, so the domain is all points to the right,
The range, as with all general logarithmic functions, is all real numbers. And we can see the end behavior because the graph goes down as it goes left and up as it goes right. The end behavior is that as
and as
Access these online resources for additional instruction and practice with graphing logarithms.
When the parent function
is multiplied by
the result is a reflection about the
x -axis. When the input is multiplied by
the result is a reflection about the
y -axis.
The equation
represents a reflection of the parent function about the
x- axis.
The equation
represents a reflection of the parent function about the
y- axis.
In biology, a pathogen (Greek: πάθος pathos "suffering", "passion" and -γενής -genēs "producer of") in the oldest and broadest sense, is anything that can produce disease. A pathogen may also be referred to as an infectious agent, or simply a germ.
The term pathogen came into use in the 1880s.[1][2
Biology is the study of living organisms, divided into many specialized field that cover their morphology, physiology,anatomy, behaviour,origin and distribution.
Lisah
biology is the study of life.
Alfreda
Biology is the study of how living organisms live and survive in a specific environment
Sifune
Got questions? Join the online conversation and get instant answers!