<< Chapter < Page Chapter >> Page >

Write a formula for the function graphed in [link] .

A graph of 4sin((pi/5)x-pi/5)+4. Graph has period of 10, amplitude of 4, range of [0,8].

two possibilities: y = 4 sin ( π 5 x π 5 ) + 4 or y = 4 sin ( π 5 x + 4 π 5 ) + 4

Got questions? Get instant answers now!

Graphing variations of y = sin x And y = cos x

Throughout this section, we have learned about types of variations of sine and cosine functions and used that information to write equations from graphs. Now we can use the same information to create graphs from equations.

Instead of focusing on the general form equations

y = A sin ( B x C ) + D  and  y = A cos ( B x C ) + D ,

we will let C = 0 and D = 0 and work with a simplified form of the equations in the following examples.

Given the function y = A sin ( B x ) , sketch its graph.

  1. Identify the amplitude, | A | .
  2. Identify the period, P = 2 π | B | .
  3. Start at the origin, with the function increasing to the right if A is positive or decreasing if A is negative.
  4. At x = π 2 | B | there is a local maximum for A > 0 or a minimum for A < 0 , with y = A .
  5. The curve returns to the x -axis at x = π | B | .
  6. There is a local minimum for A > 0 (maximum for A < 0 ) at x = 3 π 2 | B | with y = A .
  7. The curve returns again to the x -axis at x = π 2 | B | .

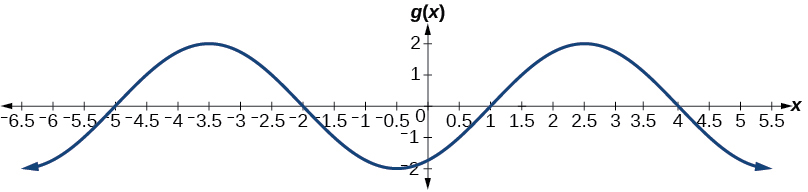
Graphing a function and identifying the amplitude and period

Sketch a graph of f ( x ) = 2 sin ( π x 2 ) .

Let’s begin by comparing the equation to the form y = A sin ( B x ) .

  • Step 1. We can see from the equation that A = 2 , so the amplitude is 2.
    | A | = 2
  • Step 2. The equation shows that B = π 2 , so the period is
    P = 2 π π 2    = 2 π 2 π    = 4
  • Step 3. Because A is negative, the graph descends as we move to the right of the origin.
  • Step 4–7. The x -intercepts are at the beginning of one period, x = 0 , the horizontal midpoints are at x = 2 and at the end of one period at x = 4.

The quarter points include the minimum at x = 1 and the maximum at x = 3. A local minimum will occur 2 units below the midline, at x = 1 , and a local maximum will occur at 2 units above the midline, at x = 3. [link] shows the graph of the function.

A graph of -2sin((pi/2)x). Graph has range of [-2,2], period of 4, and amplitude of 2.
Got questions? Get instant answers now!

Sketch a graph of g ( x ) = 0.8 cos ( 2 x ) . Determine the midline, amplitude, period, and phase shift.

A graph of -0.8cos(2x). Graph has range of [-0.8, 0.8], period of pi, amplitude of 0.8, and is reflected about the x-axis compared to it's parent function cos(x).

midline: y = 0 ; amplitude: | A | = 0.8 ; period: P = 2 π | B | = π ; phase shift: C B = 0 or none

Got questions? Get instant answers now!

Given a sinusoidal function with a phase shift and a vertical shift, sketch its graph.

  1. Express the function in the general form y = A sin ( B x C ) + D  or  y = A cos ( B x C ) + D .
  2. Identify the amplitude, | A | .
  3. Identify the period, P = 2 π | B | .
  4. Identify the phase shift, C B .
  5. Draw the graph of f ( x ) = A sin ( B x ) shifted to the right or left by C B and up or down by D .

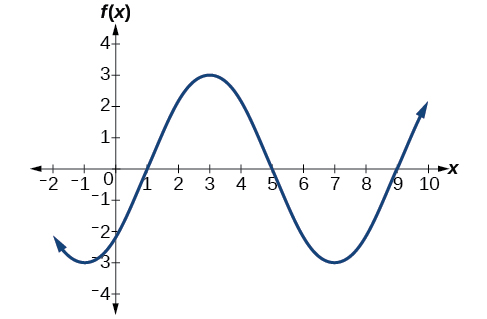
Graphing a transformed sinusoid

Sketch a graph of f ( x ) = 3 sin ( π 4 x π 4 ) .

  • Step 1. The function is already written in general form: f ( x ) = 3 sin ( π 4 x π 4 ) . This graph will have the shape of a sine function    , starting at the midline and increasing to the right.
  • Step 2. | A | = | 3 | = 3. The amplitude is 3.
  • Step 3. Since | B | = | π 4 | = π 4 , we determine the period as follows.
    P = 2 π | B | = 2 π π 4 = 2 π 4 π = 8

    The period is 8.

  • Step 4. Since C = π 4 , the phase shift is
    C B = π 4 π 4 = 1.

    The phase shift is 1 unit.

  • Step 5. [link] shows the graph of the function.
    A graph of 3sin(*(pi/4)x-pi/4). Graph has amplitude of 3, period of 8, and a phase shift of 1 to the right.
    A horizontally compressed, vertically stretched, and horizontally shifted sinusoid
Got questions? Get instant answers now!

Draw a graph of g ( x ) = 2 cos ( π 3 x + π 6 ) . Determine the midline, amplitude, period, and phase shift.

A graph of -2cos((pi/3)x+(pi/6)). Graph has amplitude of 2, period of 6, and has a phase shift of 0.5 to the left.

midline: y = 0 ; amplitude: | A | = 2 ; period: P = 2 π | B | = 6 ; phase shift: C B = 1 2

Got questions? Get instant answers now!

Questions & Answers

calculate molarity of NaOH solution when 25.0ml of NaOH titrated with 27.2ml of 0.2m H2SO4
Gasin Reply
what's Thermochemistry
rhoda Reply
the study of the heat energy which is associated with chemical reactions
Kaddija
How was CH4 and o2 was able to produce (Co2)and (H2o
Edafe Reply
explain please
Victory
First twenty elements with their valences
Martine Reply
what is chemistry
asue Reply
what is atom
asue
what is the best way to define periodic table for jamb
Damilola Reply
what is the change of matter from one state to another
Elijah Reply
what is isolation of organic compounds
IKyernum Reply
what is atomic radius
ThankGod Reply
Read Chapter 6, section 5
Dr
Read Chapter 6, section 5
Kareem
Atomic radius is the radius of the atom and is also called the orbital radius
Kareem
atomic radius is the distance between the nucleus of an atom and its valence shell
Amos
Read Chapter 6, section 5
paulino
Bohr's model of the theory atom
Ayom Reply
is there a question?
Dr
when a gas is compressed why it becomes hot?
ATOMIC
It has no oxygen then
Goldyei
read the chapter on thermochemistry...the sections on "PV" work and the First Law of Thermodynamics should help..
Dr
Which element react with water
Mukthar Reply
Mgo
Ibeh
an increase in the pressure of a gas results in the decrease of its
Valentina Reply
definition of the periodic table
Cosmos Reply
What is the lkenes
Da Reply
what were atoms composed of?
Moses Reply
Got questions? Join the online conversation and get instant answers!
Jobilize.com Reply
Practice Key Terms 5

Get Jobilize Job Search Mobile App in your pocket Now!

Get it on Google Play Download on the App Store Now


Source:  OpenStax, Precalculus. OpenStax CNX. Jan 19, 2016 Download for free at https://legacy.cnx.org/content/col11667/1.6
Google Play and the Google Play logo are trademarks of Google Inc.

Notification Switch

Would you like to follow the 'Precalculus' conversation and receive update notifications?

Ask