

| << Chapter < Page | Chapter >> Page > |
Inductively coupled plasma mass spectroscopy (ICP-MS) is an analytical technique for determining trace multi-elemental and isotopic concentrations in liquid, solid, or gaseous samples. It combines an ion-generating argon plasma source with the sensitive detection limit of mass spectrometry detection. Although ICP-MS is used for many different types of elemental analysis, including pharmaceutical testing and reagent manufacturing, this module will focus on its applications in mineral and water studies. Although akin to ICP-AES (inductively coupled plasma atomic emission spectroscopy), ICP-MS has significant differences, which will be mentioned as well.
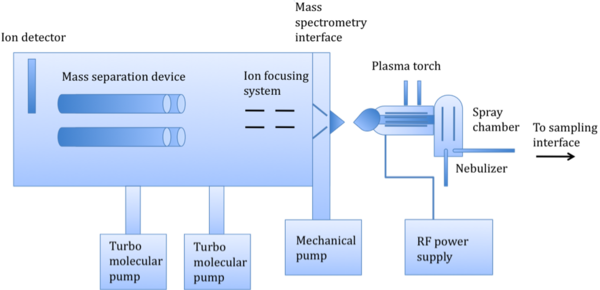
As shown in [link] there are several basic components of an ICP-MS instrument, which consist of a sampling interface, a peristaltic pump leading to a nebulizer, a spray chamber, a plasma torch, a detector, an interface, and ion-focusing system, a mass-separation device, and a vacuum chamber, maintained by turbo molecular pumps. The basic operation works as follows: a liquid sample is pumped into the nebulizer to convert the sample into a spray. An internal standard, such as germanium, is pumped into a mixer along with the sample prior to nebulization to compensate for matrix effects. Large droplets are filtered out, and small droplets continue into the plasma torch, turning to ions. The mass separation device separates these ions based on their mass-to-charge ratio. An ion detector then converts these ions into an electrical signal, which is multiplied and read by computer software.
The main difference between ICP-MS and ICP-AES is the way in which the ions are generated and detected. In ICP-AES, the ions are excited by vertical plasma, emitting photons that are separated on the basis of their emission wavelengths. As implied by the name, ICP-MS separates the ions, generated by horizontal plasma, on the basis of their mass-to-charge ratios ( m/z ). In fact, caution is taken to prevent photons from reaching the detector and creating background noise. The difference in ion formation and detection methods has a significant impact on the relative sensitivities of the two techniques. While both methods are capable of very fast, high throughput multi-elemental analysis (~10 - 40 elements per minute per sample), ICP-MS has a detection limit of a few ppt to a few hundred ppm, compared to the ppb-ppm range (~1 ppb - 100 ppm) of ICP-AES. ICP-MS also works over eight orders of magnitude detection level compared to ICP-AES’ six. As a result of its lower sensitivity, ICP-MS is a more expensive system. One other important difference is that only ICP-MS can distinguish between different isotopes of an element, as it segregates ions based on mass. A comparison of the two techniques is summarized in [link] .
| ICP-MS | ICP-AES | |
| Plasma | Horizontal: generates cations | Vertical: excites atoms, which emit photons |
| Ion detection | Mass-to-charge ratio | Wavelength of emitted light |
| Detection limit | 1-10 ppt | 1-10 ppb |
| Working range | 8 orders of magnitude | 6 orders of magnitude |
| Throughput | 20-30 elements per minute | 10-40 elements per minute |
| Isotope detection | Yes | No |
| Cost | ~$150,000 | ~$50,000 |
| Multi-element detection | Yes | Yes |
| Spectral interferences | Predictable, less than 300 | Much greater in number and more complicated to correct |
| Routine accessories | Electrothermal vaporization, laser ablation, high-performance liquid chromatography, etc. | Rare |
Notification Switch
Would you like to follow the 'Physical methods in chemistry and nano science' conversation and receive update notifications?

|
|

|
|

|
|

|
|

|
|
|
|
|

|
|

|
|

|
|
|
|