

| << Chapter < Page | Chapter >> Page > |
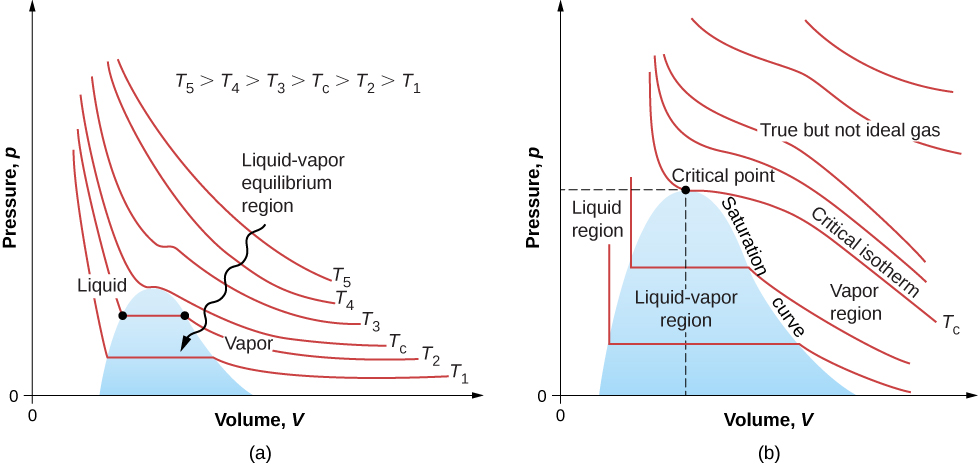
The isotherms above do not go through the liquid-gas transition. Therefore, liquid cannot exist above that temperature, which is the critical temperature (described in the chapter on temperature and heat). At sufficiently low pressure above that temperature, the gas has the density of a liquid but will not condense; the gas is said to be supercritical . At higher pressure, it is solid. Carbon dioxide, for example, has no liquid phase at a temperature above . The critical pressure is the maximum pressure at which the liquid can exist. The point on the pV diagram at the critical pressure and temperature is the critical point (which you learned about in the chapter on temperature and heat). [link] lists representative critical temperatures and pressures.
| Substance | Critical temperature | Critical pressure | ||
|---|---|---|---|---|
| K | Pa | atm | ||
| Water | 647.4 | 374.3 | 219.0 | |
| Sulfur dioxide | 430.7 | 157.6 | 78.0 | |
| Ammonia | 405.5 | 132.4 | 111.7 | |
| Carbon dioxide | 304.2 | 31.1 | 73.2 | |
| Oxygen | 154.8 | –118.4 | 50.3 | |
| Nitrogen | 126.2 | –146.9 | 33.6 | |
| Hydrogen | 33.3 | –239.9 | 12.9 | |
| Helium | 5.3 | –267.9 | 2.27 |
Two molecules can react with one molecule to produce two molecules. How many moles of hydrogen molecules are needed to react with one mole of oxygen molecules?
2 moles, as that will contain twice as many molecules as the 1 mole of oxygen
Under what circumstances would you expect a gas to behave significantly differently than predicted by the ideal gas law?
A constant-volume gas thermometer contains a fixed amount of gas. What property of the gas is measured to indicate its temperature?
pressure
Notification Switch
Would you like to follow the 'University physics volume 2' conversation and receive update notifications?

|
|

|
|

|
|

|
|

|
|

|
|

|
|

|
|

|
|
|
|