<< Chapter < Page Chapter >> Page >

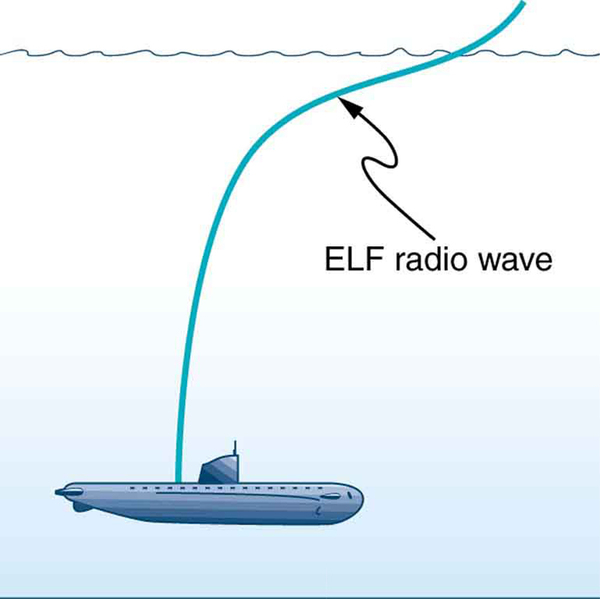
Extremely low frequency (ELF) radio waves of about 1 kHz are used to communicate with submerged submarines. The ability of radio waves to penetrate salt water is related to their wavelength (much like ultrasound penetrating tissue)—the longer the wavelength, the farther they penetrate. Since salt water is a good conductor, radio waves are strongly absorbed by it, and very long wavelengths are needed to reach a submarine under the surface. (See [link] .)

The picture of a submarine under water is shown. The submarine is shown to receive extremely low frequency signals shown as a curvy line from the ocean surface to the submarine in the ocean depth.
Very long wavelength radio waves are needed to reach this submarine, requiring extremely low frequency signals (ELF). Shorter wavelengths do not penetrate to any significant depth.

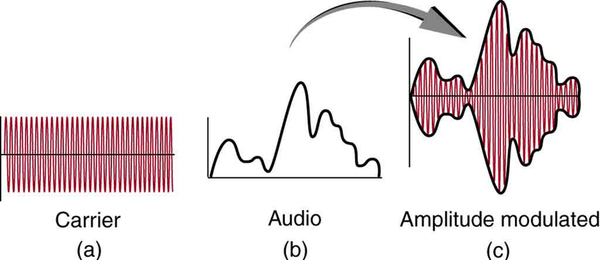
AM radio waves are used to carry commercial radio signals in the frequency range from 540 to 1600 kHz. The abbreviation AM stands for amplitude modulation , which is the method for placing information on these waves. (See [link] .) A carrier wave    having the basic frequency of the radio station, say 1530 kHz, is varied or modulated in amplitude by an audio signal. The resulting wave has a constant frequency, but a varying amplitude.

A radio receiver tuned to have the same resonant frequency as the carrier wave can pick up the signal, while rejecting the many other frequencies impinging on its antenna. The receiver’s circuitry is designed to respond to variations in amplitude of the carrier wave to replicate the original audio signal. That audio signal is amplified to drive a speaker or perhaps to be recorded.

Part a of the diagram shows a carrier wave along the horizontal axis. The wave is shown to have a high frequency as the vibrations are closely spaced. The wave has constant amplitude represented by uniform height of crest and trough. Part b of the diagram shows an audio wave with a lower frequency. The wave is on the upper side of horizontal axis. The amplitude of the wave is not uniform. It has an initial small rise and fall followed by a steep rise and a gradual fall in the wave. Part c of the diagram shows the amplitude modulated wave. It is the resultant wave obtained by mixing of the waves in part a and part b. The amplitude of the resultant wave is non uniform, similar to the audio wave. The frequency of the amplitude modulated wave is equal to the frequency of the carrier wave. The wave spreads on both sides of the horizontal axis.
Amplitude modulation for AM radio. (a) A carrier wave at the station’s basic frequency. (b) An audio signal at much lower audible frequencies. (c) The amplitude of the carrier is modulated by the audio signal without changing its basic frequency.

Fm radio waves

FM radio waves are also used for commercial radio transmission, but in the frequency range of 88 to 108 MHz. FM stands for frequency modulation , another method of carrying information. (See [link] .) Here a carrier wave having the basic frequency of the radio station, perhaps 105.1 MHz, is modulated in frequency by the audio signal, producing a wave of constant amplitude but varying frequency.

Part a of the diagram shows a carrier wave along the horizontal axis. The wave is shown to have a high frequency as the vibrations are closely spaced. The wave has constant amplitude represented by uniform height of crest and trough. Part b of the diagram shows an audio wave with a lower frequency as shown by widely spaced vibrations. The wave has constant amplitude, represented by uniform length of crest and trough. Part c shows the frequency modulated wave obtained from waves in part a and part b. The amplitude of the resultant wave is similar to the source waves but the frequency varies. Frequency maxima are shown as closely spaced vibrations and frequency minima are shown as widely spaced vibrations. These maxima and minima are shown to alternate.
Frequency modulation for FM radio. (a) A carrier wave at the station’s basic frequency. (b) An audio signal at much lower audible frequencies. (c) The frequency of the carrier is modulated by the audio signal without changing its amplitude.

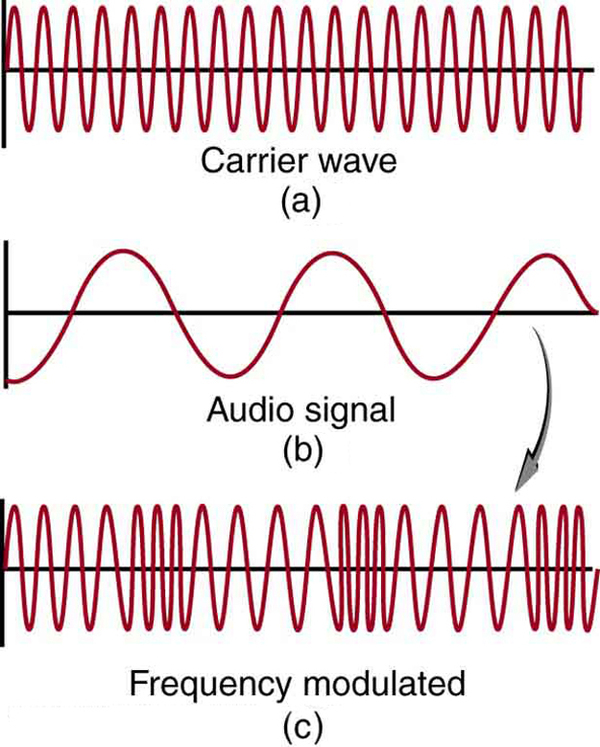
Since audible frequencies range up to 20 kHz (or 0.020 MHz) at most, the frequency of the FM radio wave can vary from the carrier by as much as 0.020 MHz. Thus the carrier frequencies of two different radio stations cannot be closer than 0.020 MHz. An FM receiver is tuned to resonate at the carrier frequency and has circuitry that responds to variations in frequency, reproducing the audio information.

FM radio is inherently less subject to noise from stray radio sources than AM radio. The reason is that amplitudes of waves add. So an AM receiver would interpret noise added onto the amplitude of its carrier wave as part of the information. An FM receiver can be made to reject amplitudes other than that of the basic carrier wave and only look for variations in frequency. It is thus easier to reject noise from FM, since noise produces a variation in amplitude.

Questions & Answers

Ayele, K., 2003. Introductory Economics, 3rd ed., Addis Ababa.
Widad Reply
can you send the book attached ?
Ariel
?
Ariel
What is economics
Widad Reply
the study of how humans make choices under conditions of scarcity
AI-Robot
U(x,y) = (x×y)1/2 find mu of x for y
Desalegn Reply
U(x,y) = (x×y)1/2 find mu of x for y
Desalegn
what is ecnomics
Jan Reply
this is the study of how the society manages it's scarce resources
Belonwu
what is macroeconomic
John Reply
macroeconomic is the branch of economics which studies actions, scale, activities and behaviour of the aggregate economy as a whole.
husaini
etc
husaini
difference between firm and industry
husaini Reply
what's the difference between a firm and an industry
Abdul
firm is the unit which transform inputs to output where as industry contain combination of firms with similar production 😅😅
Abdulraufu
Suppose the demand function that a firm faces shifted from Qd  120 3P to Qd  90  3P and the supply function has shifted from QS  20  2P to QS 10  2P . a) Find the effect of this change on price and quantity. b) Which of the changes in demand and supply is higher?
Toofiq Reply
explain standard reason why economic is a science
innocent Reply
factors influencing supply
Petrus Reply
what is economic.
Milan Reply
scares means__________________ends resources. unlimited
Jan
economics is a science that studies human behaviour as a relationship b/w ends and scares means which have alternative uses
Jan
calculate the profit maximizing for demand and supply
Zarshad Reply
Why qualify 28 supplies
Milan
what are explicit costs
Nomsa Reply
out-of-pocket costs for a firm, for example, payments for wages and salaries, rent, or materials
AI-Robot
concepts of supply in microeconomics
David Reply
economic overview notes
Amahle Reply
identify a demand and a supply curve
Salome Reply
i don't know
Parul
there's a difference
Aryan
Demand curve shows that how supply and others conditions affect on demand of a particular thing and what percent demand increase whith increase of supply of goods
Israr
Hi Sir please how do u calculate Cross elastic demand and income elastic demand?
Abari
Got questions? Join the online conversation and get instant answers!
Jobilize.com Reply

Get Jobilize Job Search Mobile App in your pocket Now!

Get it on Google Play Download on the App Store Now


Source:  OpenStax, College physics. OpenStax CNX. Jul 27, 2015 Download for free at http://legacy.cnx.org/content/col11406/1.9
Google Play and the Google Play logo are trademarks of Google Inc.

Notification Switch

Would you like to follow the 'College physics' conversation and receive update notifications?

Ask