<< Chapter < Page Chapter >> Page >
This module is part of the collection, A First Course in Electrical and Computer Engineering . The LaTeX source files for this collection were created using an optical character recognition technology, and because of this process there may be more errors than usual. Please contact us if you discover any errors.

There are two key ideas behind the phasor representation of a signal:

  1. a real, time-varying signal may be represented by a complex, time-varying signal; and
  2. a complex, time-varying signal may be represented as the product of a complex number that is independent of time and a complex signal that is dependent on time.

Let's be concrete. The signal

x ( t ) = A cos ( ω t + φ ) ,

illustrated in [link] , is a cosinusoidal signal with amplitude A , frequency ω , and phase φ . The amplitude A characterizes the peak-to-peak swing of 2 A , the angular frequency ω characterizes the period T = 2 π ω between negative- to-positive zero crossings (or positive peaks or negative peaks), and the phase φ characterizes the time τ = - φ ω when the signal reaches its first peak. With τ so defined, the signal x ( t ) may also be written as

x ( t ) = A cos ω ( t - τ ) .
Figure one is a cartesian graph with a sinusoidal function and a couple labeled arrows. The sinusoidal curve is labeled Acos(ωt+Φ) versus t. The amplitude of the curve, or the distance from the middle of the curve at the horizontal axis to its peak is labeled A. The horizontal distance from the beginning of an upward part of the curve to the end of a downward portion of the curve, or a complete wave, is labeled T = 2π/ω. The distance from the vertical axis to the first peak in the first quadrant of the graph is labeled 𝞃 = -Φ/ω. Figure one is a cartesian graph with a sinusoidal function and a couple labeled arrows. The sinusoidal curve is labeled Acos(ωt+Φ) versus t. The amplitude of the curve, or the distance from the middle of the curve at the horizontal axis to its peak is labeled A. The horizontal distance from the beginning of an upward part of the curve to the end of a downward portion of the curve, or a complete wave, is labeled T = 2π/ω. The distance from the vertical axis to the first peak in the first quadrant of the graph is labeled 𝞃 = -Φ/ω.
A Cosinusoidal Signal

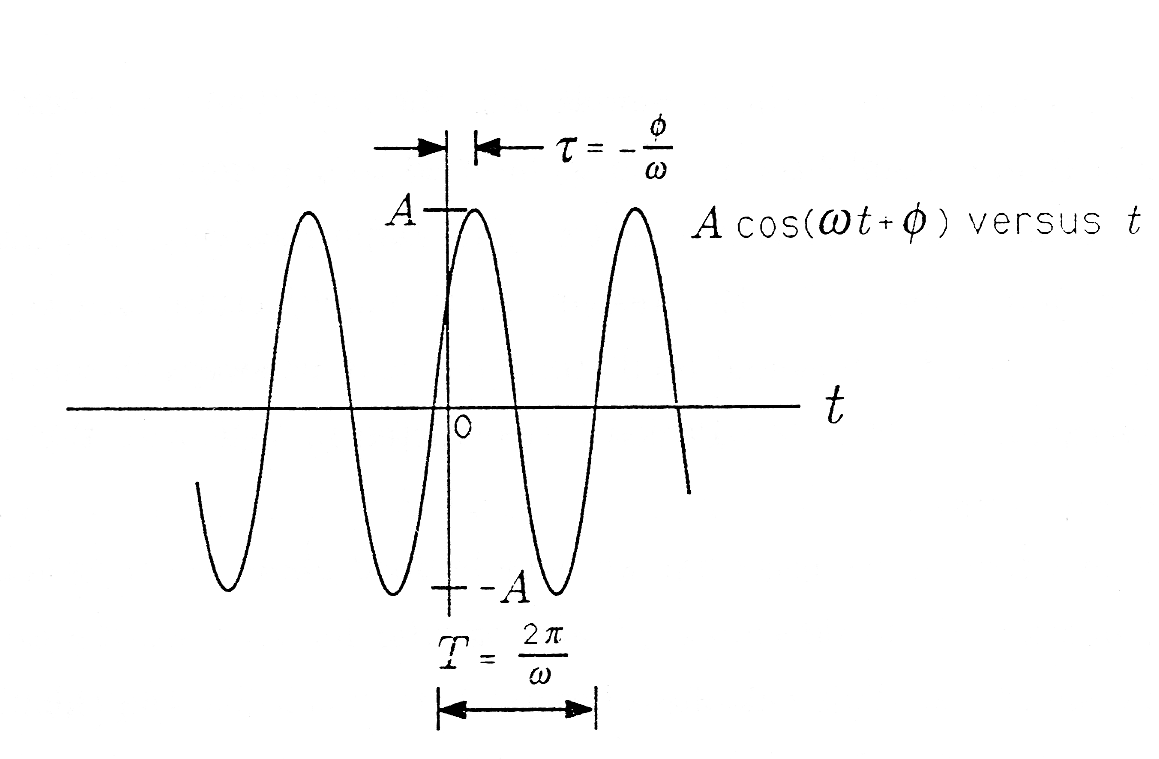
When τ is positive, then τ is a “time delay” that describes the time (greater than zero) when the first peak is achieved. When τ is negative, then τ is a “time advance” that describes the time (less than zero) when the last peakwas achieved. With the substitution ω = 2 π T we obtain a third way of writing x ( t ) :

x ( t ) = A cos 2 π T ( t - τ ) .

In this form the signal is easy to plot. Simply draw a cosinusoidal wave with amplitude A and period T ; then strike the origin ( t = 0 ) so that the signal reaches its peak at τ . In summary, the parameters that determine a cosinusoidal signal have the following units:

A , arbitrary (e.g., volts or meters/sec, depending upon the application)

ω , in radians/sec (rad/sec)

T , in seconds (sec)

φ , in radians (rad)

τ , in seconds (sec)

The signal x ( t ) = A cos ( ω t + φ ) can be represented as the real part of a complex number:

x ( t ) = Re [ A e j ( ω t + φ ) ] = Re [ A e j φ e j ω t ] .

We call A e j φ e j ω t the complex representation of x ( t ) and write

x ( t ) A e j φ e j ω t ,

meaning that the signal x ( t ) may be reconstructed by taking the real part of A e j φ e j ω t . In this representation, we call A e j φ the phasor or complex amplitude representation of x ( t ) and write

x ( t ) A e j φ ,

meaning that the signal x ( t ) may be reconstructed from A e j φ by multiplying with e j ω t and taking the real part. In communication theory, we call A e j φ the baseband representation of the signal x ( t ) .

Geometric Interpretation. Let's call

A e j φ e j ω t

the complex representation of the real signal A cos ( ω t + φ ) . At t = 0 , the complex representation produces the phasor

A e j φ .

This phasor is illustrated in [link] . In the figure, φ is approximately - π 10 If we let t increase to time t 1 , then the complex representation produces the phasor

Figure two is a dashed unit circle on a cartesian graph. It is titled with the expression Ae^jΦ e^jωt_1. Along the unit circle are various line segments extending from the origin to the edge of the circle at various points. Horizontally to the right is the first line segment, labeled A (t = -Φ/ω). There is one line segment in the first quadrant, in what looks to be approximately 45 degrees from the horizontal axis. This line is labeled Ae^(jΦ) e^(jωt_1)  (t = t_1). An arrow between this line and the aforementioned line on the horizontal axis indicates movement in the clockwise direction. There is one line segment in the second quadrant beginning at the origin and extending to a point on the unit circle, in what looks to be approximately 150 degrees from the original horizontal axis on the right side of the graph. This line is labeled Ae^(jΦ) e^(jωt_2)  (t = t_2). In between this line and the previously described line in the first quadrant is an arrow pointing both in the clockwise and counter-clockwise directions, labeled ω(t_2 - t_1).  There are two line segments in the fourth quadrant, both extending from the origin to a point on the circle. The first is approximately 20 degrees to the right from the lower vertical axis. It is labeled Ae^(jΦ) e^(jωt_3)  (t = t_3). The second is approximately 20 degrees below the positive side of the horizontal axis, and is labeled Ae^(jΦ) (t = 0). In between the two line segments in the fourth quadrant is an arrow indicating movement in the counter-clockwise direction. Figure two is a dashed unit circle on a cartesian graph. It is titled with the expression Ae^jΦ e^jωt_1. Along the unit circle are various line segments extending from the origin to the edge of the circle at various points. Horizontally to the right is the first line segment, labeled A (t = -Φ/ω). There is one line segment in the first quadrant, in what looks to be approximately 45 degrees from the horizontal axis. This line is labeled Ae^(jΦ) e^(jωt_1)  (t = t_1). An arrow between this line and the aforementioned line on the horizontal axis indicates movement in the clockwise direction. There is one line segment in the second quadrant beginning at the origin and extending to a point on the unit circle, in what looks to be approximately 150 degrees from the original horizontal axis on the right side of the graph. This line is labeled Ae^(jΦ) e^(jωt_2)  (t = t_2). In between this line and the previously described line in the first quadrant is an arrow pointing both in the clockwise and counter-clockwise directions, labeled ω(t_2 - t_1).  There are two line segments in the fourth quadrant, both extending from the origin to a point on the circle. The first is approximately 20 degrees to the right from the lower vertical axis. It is labeled Ae^(jΦ) e^(jωt_3)  (t = t_3). The second is approximately 20 degrees below the positive side of the horizontal axis, and is labeled Ae^(jΦ) (t = 0). In between the two line segments in the fourth quadrant is an arrow indicating movement in the counter-clockwise direction.
Rotating Phasor

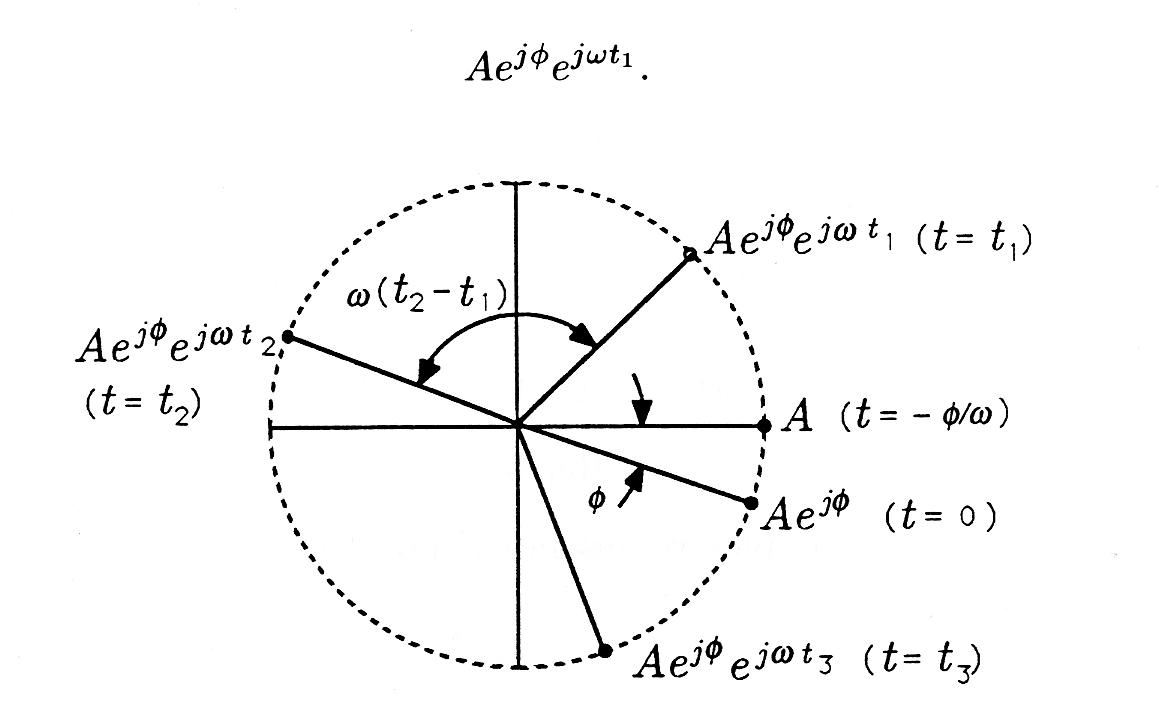
We know from our study of complex numbers that e j ω t 1 just rotates the phasor A e j φ through an angle of ω t 1 ! See [link] . Therefore, as we run t from 0, indefinitely, we rotate the phasor A e j φ indefinitely, turning out the circular trajectory of [link] . When t = 2 π ω then e j ω t = e j 2 π = 1 . Therefore, every ( 2 π ω ) seconds, the phasor revisits any given position on the circle of radius A . We sometimes call A e j φ e j ω t a rotating phasor whose rotation rate is the frequency ω :

Questions & Answers

how does Neisseria cause meningitis
Nyibol Reply
what is microbiologist
Muhammad Reply
what is errata
Muhammad
is the branch of biology that deals with the study of microorganisms.
Ntefuni Reply
What is microbiology
Mercy Reply
studies of microbes
Louisiaste
when we takee the specimen which lumbar,spin,
Ziyad Reply
How bacteria create energy to survive?
Muhamad Reply
Bacteria doesn't produce energy they are dependent upon their substrate in case of lack of nutrients they are able to make spores which helps them to sustain in harsh environments
_Adnan
But not all bacteria make spores, l mean Eukaryotic cells have Mitochondria which acts as powerhouse for them, since bacteria don't have it, what is the substitution for it?
Muhamad
they make spores
Louisiaste
what is sporadic nd endemic, epidemic
Aminu Reply
the significance of food webs for disease transmission
Abreham
food webs brings about an infection as an individual depends on number of diseased foods or carriers dully.
Mark
explain assimilatory nitrate reduction
Esinniobiwa Reply
Assimilatory nitrate reduction is a process that occurs in some microorganisms, such as bacteria and archaea, in which nitrate (NO3-) is reduced to nitrite (NO2-), and then further reduced to ammonia (NH3).
Elkana
This process is called assimilatory nitrate reduction because the nitrogen that is produced is incorporated in the cells of microorganisms where it can be used in the synthesis of amino acids and other nitrogen products
Elkana
Examples of thermophilic organisms
Shu Reply
Give Examples of thermophilic organisms
Shu
advantages of normal Flora to the host
Micheal Reply
Prevent foreign microbes to the host
Abubakar
they provide healthier benefits to their hosts
ayesha
They are friends to host only when Host immune system is strong and become enemies when the host immune system is weakened . very bad relationship!
Mark
what is cell
faisal Reply
cell is the smallest unit of life
Fauziya
cell is the smallest unit of life
Akanni
ok
Innocent
cell is the structural and functional unit of life
Hasan
is the fundamental units of Life
Musa
what are emergency diseases
Micheal Reply
There are nothing like emergency disease but there are some common medical emergency which can occur simultaneously like Bleeding,heart attack,Breathing difficulties,severe pain heart stock.Hope you will get my point .Have a nice day ❣️
_Adnan
define infection ,prevention and control
Innocent
I think infection prevention and control is the avoidance of all things we do that gives out break of infections and promotion of health practices that promote life
Lubega
Heyy Lubega hussein where are u from?
_Adnan
en français
Adama
which site have a normal flora
ESTHER Reply
Many sites of the body have it Skin Nasal cavity Oral cavity Gastro intestinal tract
Safaa
skin
Asiina
skin,Oral,Nasal,GIt
Sadik
How can Commensal can Bacteria change into pathogen?
Sadik
How can Commensal Bacteria change into pathogen?
Sadik
all
Tesfaye
by fussion
Asiina
what are the advantages of normal Flora to the host
Micheal
what are the ways of control and prevention of nosocomial infection in the hospital
Micheal
what is inflammation
Shelly Reply
part of a tissue or an organ being wounded or bruised.
Wilfred
what term is used to name and classify microorganisms?
Micheal Reply
Binomial nomenclature
adeolu
Got questions? Join the online conversation and get instant answers!
Jobilize.com Reply

Get Jobilize Job Search Mobile App in your pocket Now!

Get it on Google Play Download on the App Store Now


Source:  OpenStax, A first course in electrical and computer engineering. OpenStax CNX. Sep 14, 2009 Download for free at http://cnx.org/content/col10685/1.2
Google Play and the Google Play logo are trademarks of Google Inc.

Notification Switch

Would you like to follow the 'A first course in electrical and computer engineering' conversation and receive update notifications?

Ask