<< Chapter < Page Chapter >> Page >

Chebyshev filter properties

The Butterworth filter does not give a sufficiently good approximation across the complete passband in many cases. TheTaylor's series approximation is often not suited to the way specifications are given for filters. An alternate error measure isthe maximum of the absolute value of the difference between the actual filter response and the ideal. This is considered over thetotal passband. This is the Chebyshev error measure and was defined and applied to the FIR filter design problem. For the IIR filter,the Chebyshev error is minimized over the passband and a Taylor's series approximation at ω = is used to determine the stopband performance. This mixture of methods in the IIR case iscalled the Chebyshev filter, and simple design formulas result, just as for the Butterworth filter.

The design of Chebyshev filters is particularly interesting, because the results of a very elegant theory insure thatconstructing a frequency-response function with the proper form of equal ripple in the error will result in a minimum Chebyshev errorwithout explicitly minimizing anything. This allows a straightforward set of design formulas to be derived which can beviewed as a generalization of the Butterworth formulas [link] , [link] .

The form for the magnitude squared of the frequency-response function for the Chebyshev filter is

| F ( j ω ) | 2 = 1 1 + ϵ 2 C N ( ω ) 2

where C N ( ω ) is an Nth-order Chebyshev polynomial and ϵ is a parameter that controls the ripple size. This polynomial in ω has very special characteristics that result in the optimality of the response function [link] .

Chebyshev polynomials

The Chebyshev polynomial is a powerful function in approximation theory. Although the function is a polynomial, it isbest defined and developed in terms of trigonometric functions by [link] , [link] , [link] , [link] .

C N ( ω ) = cos ( N cos - 1 ( ω ) )

where C N ( ω ) is an Nth-order, real-valued function of the real variable ω . The development is made clearer by introducing an intermediate complex variable φ .

C N ( ω ) = cos ( N φ )

where

ω = cos ( φ )

Although this definition of C N ( ω ) may not at first appear to result in a polynomial, the following recursive relation derivedfrom [link] shows that it is a polynomial.

C N + 1 ( ω ) = 2 ω C N ( ω ) - C N - 1 ( ω )

From [link] , it is clear that C 0 = 1 and C 1 = ω , and from [link] , it follows that

C 2 = 2 ω 2 - 1
C 3 = 4 ω 3 - 3 ω
C 4 = 8 ω 4 - 8 ω 2 + 1

etc.

Other relations useful for developing these polynomials are

C N 2 ( ω ) = ( C 2 N ( ω ) + 1 ) / 2
C M N ( ω ) = C M ( C N ( ω ) )

where M and N are coprime.

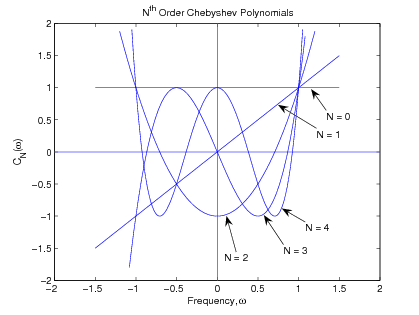
These are remarkable functions [link] . They oscillate between +1 and -1 for - 1 < ω < 1 and go monotonically to +/- infinity outside that domain. All N of their zeros are real and fall in the domain of - 1 < ω < 1 , i.e., C N is an equal ripple approximation to zero over the range of ω from -1 to +1. In addition, the values for ω where C N reaches its local maxima and minima and is zero are easily calculated from [link] and [link] . For - 1 < ω < 1 , a plot of C N ( ω ) can be made using the concept of Lissajous figures. Example plots for C 0 , C 1 , C 2 , C 3 , and C 4 are shown in [link] .

Figure one is a graph titled Nth order chebyshev polynomials. Its horizontal axis is labeled Frequency, ω, and ranges in value from -2 to 2 in increments of 0.5. The vertical axis is labeled C_N(ω) and ranges in value from -2 to 2 in increments of 0.5. There are four curves in this figure. The first is a diagonal line with constant positive slope that passes through the origin. The second is parabolic in shape with  its vertex as a minimum of the curve at (0, -1). The third starts from the bottom-left of the graph, increases to a peak at (-0.5, 1) and then decreases to a trough at (0.5, -1), where it finally increases to the top-right area of the graph. The fourth begins in the top-left as a decreasing function, and proceeds to make a trough, a peak, and a trough at (-0.5, -1), (0, 1) and (0.5, -1) respectively. The curve then increases and ends in the top-right area.
Chebyshev Polynomials for N = 0, 1, 2, 3, and 4

The filter frequency-response function for N = 5 is given in [link] showing the passband ripple in terms of the parameter ϵ .

Questions & Answers

how do you get the 2/50
Abba Reply
number of sport play by 50 student construct discrete data
Aminu Reply
width of the frangebany leaves on how to write a introduction
Theresa Reply
Solve the mean of variance
Veronica Reply
Step 1: Find the mean. To find the mean, add up all the scores, then divide them by the number of scores. ... Step 2: Find each score's deviation from the mean. ... Step 3: Square each deviation from the mean. ... Step 4: Find the sum of squares. ... Step 5: Divide the sum of squares by n – 1 or N.
kenneth
what is error
Yakuba Reply
Is mistake done to something
Vutshila
Hy
anas
hy
What is the life teble
anas
hy
Jibrin
statistics is the analyzing of data
Tajudeen Reply
what is statics?
Zelalem Reply
how do you calculate mean
Gloria Reply
diveving the sum if all values
Shaynaynay
let A1,A2 and A3 events be independent,show that (A1)^c, (A2)^c and (A3)^c are independent?
Fisaye Reply
what is statistics
Akhisani Reply
data collected all over the world
Shaynaynay
construct a less than and more than table
Imad Reply
The sample of 16 students is taken. The average age in the sample was 22 years with astandard deviation of 6 years. Construct a 95% confidence interval for the age of the population.
Aschalew Reply
Bhartdarshan' is an internet-based travel agency wherein customer can see videos of the cities they plant to visit. The number of hits daily is a normally distributed random variable with a mean of 10,000 and a standard deviation of 2,400 a. what is the probability of getting more than 12,000 hits? b. what is the probability of getting fewer than 9,000 hits?
Akshay Reply
Bhartdarshan'is an internet-based travel agency wherein customer can see videos of the cities they plan to visit. The number of hits daily is a normally distributed random variable with a mean of 10,000 and a standard deviation of 2,400. a. What is the probability of getting more than 12,000 hits
Akshay
1
Bright
Sorry i want to learn more about this question
Bright
Someone help
Bright
a= 0.20233 b=0.3384
Sufiyan
a
Shaynaynay
How do I interpret level of significance?
Mohd Reply
It depends on your business problem or in Machine Learning you could use ROC- AUC cruve to decide the threshold value
Shivam
how skewness and kurtosis are used in statistics
Owen Reply
yes what is it
Taneeya
Got questions? Join the online conversation and get instant answers!
Jobilize.com Reply

Get Jobilize Job Search Mobile App in your pocket Now!

Get it on Google Play Download on the App Store Now


Source:  OpenStax, Digital signal processing and digital filter design (draft). OpenStax CNX. Nov 17, 2012 Download for free at http://cnx.org/content/col10598/1.6
Google Play and the Google Play logo are trademarks of Google Inc.

Notification Switch

Would you like to follow the 'Digital signal processing and digital filter design (draft)' conversation and receive update notifications?

Ask