

| << Chapter < Page | Chapter >> Page > |
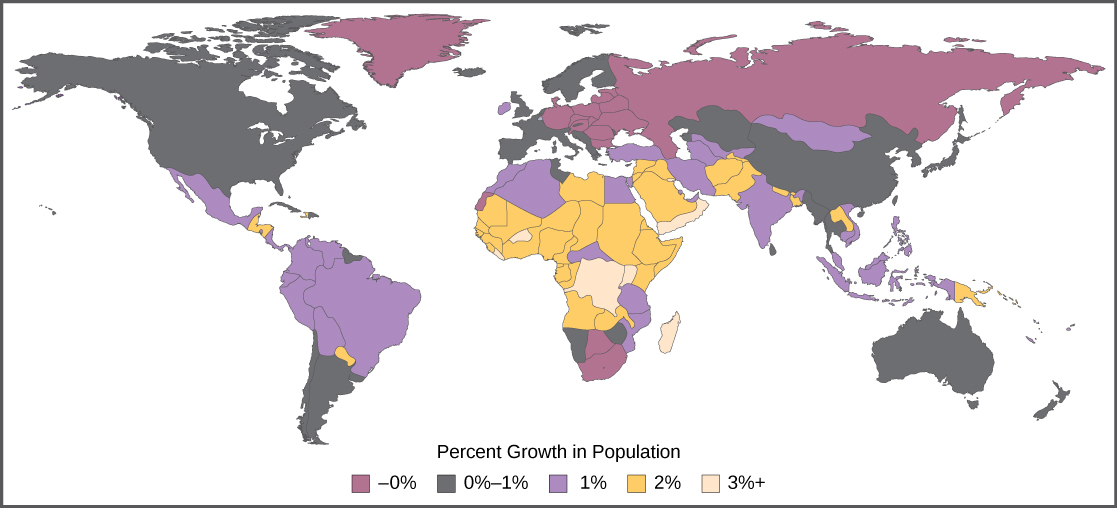
The age structure of a population is an important factor in population dynamics. Age structure is the proportion of a population at different age ranges. Age structure allows better prediction of population growth, plus the ability to associate this growth with the level of economic development in the region. Countries with rapid growth have a pyramidal shape in their age structure diagrams, showing a preponderance of younger individuals, many of whom are of reproductive age or will be soon ( [link] ). This pattern is most often observed in underdeveloped countries where individuals do not live to old age because of less-than-optimal living conditions. Age structures of areas with slow growth, including developed countries such as the United States, still have a pyramidal structure, but with many fewer young and reproductive-aged individuals and a greater proportion of older individuals. Other developed countries, such as Italy, have zero population growth. The age structure of these populations is more conical, with an even greater percentage of middle-aged and older individuals. The actual growth rates in different countries are shown in [link] , with the highest rates tending to be in the less economically developed countries of Africa and Asia.
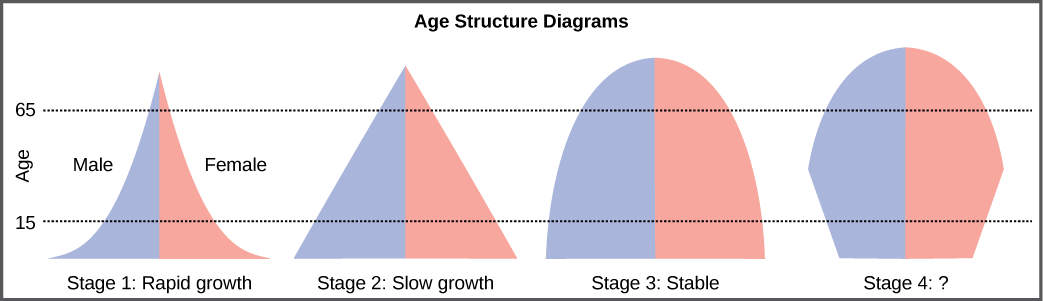
Age structure diagrams for rapidly growing, slow growing and stable populations are shown in stages 1 through 3. What type of population change do you think stage 4 represents?
Whether you believe that we are headed for environmental disaster and the end of human existence as we know it, or you think people will always adapt to changing circumstances, there are clear patterns that can be seen in population growth. Societies develop along a predictable continuum as they evolve from unindustrialized to postindustrial. Demographic transition theory (Caldwell and Caldwell 2006) suggests that future population growth will develop along a predictable four-stage model.
In Stage 1, birth, death, and infant mortality rates are all high, while life expectancy is short. An example of this stage is 1800s America. As countries begin to industrialize, they enter Stage 2, where birthrates are higher while infant mortality and the death rates drop. Life expectancy also increases. Afghanistan is currently in this stage. Stage 3 occurs once a society is thoroughly industrialized; birthrates decline, while life expectancy continues to increase. Death rates continue to decrease. Mexico’s population is at this stage. In the final phase, Stage 4, we see the postindustrial era of a society. Birth and death rates are low, people are healthier and live longer, and society enters a phase of population stability. Overall population may even decline. Sweden and the United States are considered Stage 4.
Notification Switch
Would you like to follow the 'Bi 101 for lbcc ilearn campus' conversation and receive update notifications?

|
|

|
|
|
|
|

|
|

|
|

|
|

|
|

|
|

|
|

|