Descriptive Statistics: Homework is part of the collection col10555 written by Barbara Illowsky and Susan Dean and provides homework questions related to lessons about descriptive statistics.
Twenty-five randomly selected students were asked the number of movies they watched the previous week. The results are as follows:
# of movies
Frequency
Relative Frequency
Cumulative Relative Frequency
0
5
1
9
2
6
3
4
4
1
Find the sample mean
Find the sample standard deviation,
Construct a histogram of the data.
Complete the columns of the chart.
Find the first quartile.
Find the median.
Find the third quartile.
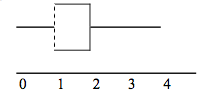
Construct a box plot of the data.
What percent of the students saw fewer than three movies?
Find the 40th percentile.
Find the 90th percentile.
Construct a line graph of the data.
Construct a stem plot of the data.
1.48
1.12
1
1
2
80%
1
3
The median age for U.S. blacks currently is 30.9 years; for U.S. whites it is 42.3 years. ((
Source: http://www.usatoday.com/news/nation/story/2012-05-17/minority-births-census/55029100/1) )
Based upon this information, give two reasons why the black median age could be lower than the white median age.
Does the lower median age for blacks necessarily mean that blacks die younger than whites? Why or why not?
How might it be possible for blacks and whites to die at approximately the same age, but for the median age for whites to be higher?
Forty randomly selected students were asked the number of pairs of sneakers they owned. Let X = the number of pairs of sneakers owned. The results are as follows:
X
Frequency
Relative Frequency
Cumulative Relative Frequency
1
2
2
5
3
8
4
12
5
12
7
1
Find the sample mean
Find the sample standard deviation,
Construct a histogram of the data.
Complete the columns of the chart.
Find the first quartile.
Find the median.
Find the third quartile.
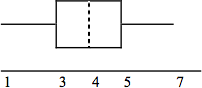
Construct a box plot of the data.
What percent of the students owned at least five pairs?
Find the 40th percentile.
Find the 90th percentile.
Construct a line graph of the data
Construct a stem plot of the data
3.78
1.29
3
4
5
32.5%
4
5
600 adult Americans were asked by telephone poll,
What do you think constitutes a middle-class income?The results are below. Also, include left endpoint, but not the right endpoint. (
Source: Time magazine; survey by Yankelovich Partners, Inc. )
"Not sure" answers were omitted from the results.
Salary ($)
Relative Frequency
<20,000
0.02
20,000 - 25,000
0.09
25,000 - 30,000
0.19
30,000 - 40,000
0.26
40,000 - 50,000
0.18
50,000 - 75,000
0.17
75,000 - 99,999
0.02
100,000+
0.01
What percent of the survey answered
"not sure"?
What percent think that middle-class is from $25,000 - $50,000 ?
Construct a histogram of the data
Should all bars have the same width, based on the data? Why or why not?
How should the<20,000
and the100,000+
intervals be handled? Why?
Find the 40th and 80th percentiles
Construct a bar graph of the data
Following are the published weights (in pounds) of all of the team members of the San Francisco 49ers from a previous year
(
Source: San Jose Mercury News )
177
205
210
210
232
205
185
185
178
210
206
212
184
174
185
242
188
212
215
247
241
223
220
260
245
259
278
270
280
295
275
285
290
272
273
280
285
286
200
215
185
230
250
241
190
260
250
302
265
290
276
228
265
Organize the data from smallest to largest value.
Find the median.
Find the first quartile.
Find the third quartile.
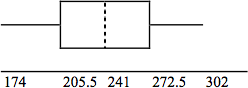
Construct a box plot of the data.
The middle 50% of the weights are from _______ to _______.
If our population were all professional football players, would the above data be a sample of weights or the population of weights? Why?
If our population were the San Francisco 49ers, would the above data be a sample of weights or the population of weights? Why?
Assume the population was the San Francisco 49ers. Find:
the population mean,
.
the population standard deviation,
.
the weight that is 2 standard deviations below the mean.
When Steve Young, quarterback, played football, he weighed 205 pounds. How many standard deviations above or below the mean was he?
That same year, the mean weight for the Dallas Cowboys was 240.08 pounds with a standard deviation of 44.38 pounds. Emmit Smith weighed in at 209 pounds. With respect to his team, who was lighter, Smith or Young? How did you determine your answer?
241
205.5
272.5
205.5, 272.5
sample
population
236.34
37.50
161.34
0.84 std. dev. below the mean
Young
Questions & Answers
Discuss the differences between taste and flavor, including how other sensory inputs contribute to our perception of flavor.
The lymphatic system plays several crucial roles in the human body, functioning as a key component of the immune system and contributing to the maintenance of fluid balance. Its main functions include:
1. Immune Response: The lymphatic system produces and transports lymphocytes, which are a type of
asegid
to transport fluids fats proteins and lymphocytes to the blood stream as lymph
Anatomy is the study of the structure of the body, while physiology is the study of the function of the body. Anatomy looks at the body's organs and systems, while physiology looks at how those organs and systems work together to keep the body functioning.
Enzymes are proteins that help speed up chemical reactions in our bodies. Enzymes are essential for digestion, liver function and much more. Too much or too little of a certain enzyme can cause health problems
Kamara
yes
Prince
how does the stomach protect itself from the damaging effects of HCl
the normal temperature is 37°c or 98.6 °Fahrenheit is important for maintaining the homeostasis in the body
the body regular this temperature through the process called thermoregulation which involves brain skin muscle and other organ working together to maintain stable internal temperature