

| << Chapter < Page | Chapter >> Page > |
To provide mathematical precision to the measurement of what we see we use the correlation coefficient. The correlation tells us something about the co-movement of two variables, but nothing about why this movement occurred. Formally, correlation analysis assumes that both variables being analyzed are independent variables. This means that neither one causes the movement in the other. Further, it means that neither variable is dependent on the other, or for that matter, on any other variable. Even with these limitations, correlation analysis can yield some interesting results.
The correlation coefficient, ρ (pronounced rho), is the mathematical statistic for a population that provides us with a measurement of the strength of a linear relationship between the two variables. For a sample of data, the statistic, r, developed by Karl Pearson in the early 1900s, is an estimate of the population correlation and is defined mathematically as:
where s x1 and s x2 are the standard deviations of the two independent variables X 1 and X 2 , and are the sample means of the two variables, and X 1i and X 2i are the individual observations of X 1 and X 2 . The correlation coefficient r ranges in value from -1 to 1. The second equivalent formula is often used because it may be computationally easier. As scary as these formulas look they are really just the ratio of the covariance between the two variables and the product of their two variances. That is to say, it is a measure of relative variances.
In practice all correlation and regression analysis will be provided through computer software designed for these purposes. Anything more than perhaps one-half a dozen observations creates immense computational problems. It was because of this fact that correlation, and even more so, regression, were not widely used research tools until after the advent of “computing machines”. Now the computing power required to analyze data using regression packages is deemed almost trivial by comparison to just a decade ago.
To visualize any linear relationship that may exist review the plot of a scatter diagrams of the standardized data. [link] presents several scatter diagrams and the calculated value of r. In panels (a) and (b) notice that the data generally trend together, (a) upward and (b) downward. Panel (a) is an example of a positive correlation and panel (b) is an example of a negative correlation, or relationship. The sign of the correlation coefficient tells us if the relationship is a positive or negative (inverse) one. If all the values of X 1 and X 2 are on a straight line the correlation coefficient will be either 1 or -1 depending on whether the line has a positive or negative slope and the closer to one or negative one the stronger the relationship between the two variables. BUT ALWAYS REMEMBER THAT THE CORRELATION COEFFICIENT DOES NOT TELL US THE SLOPE.
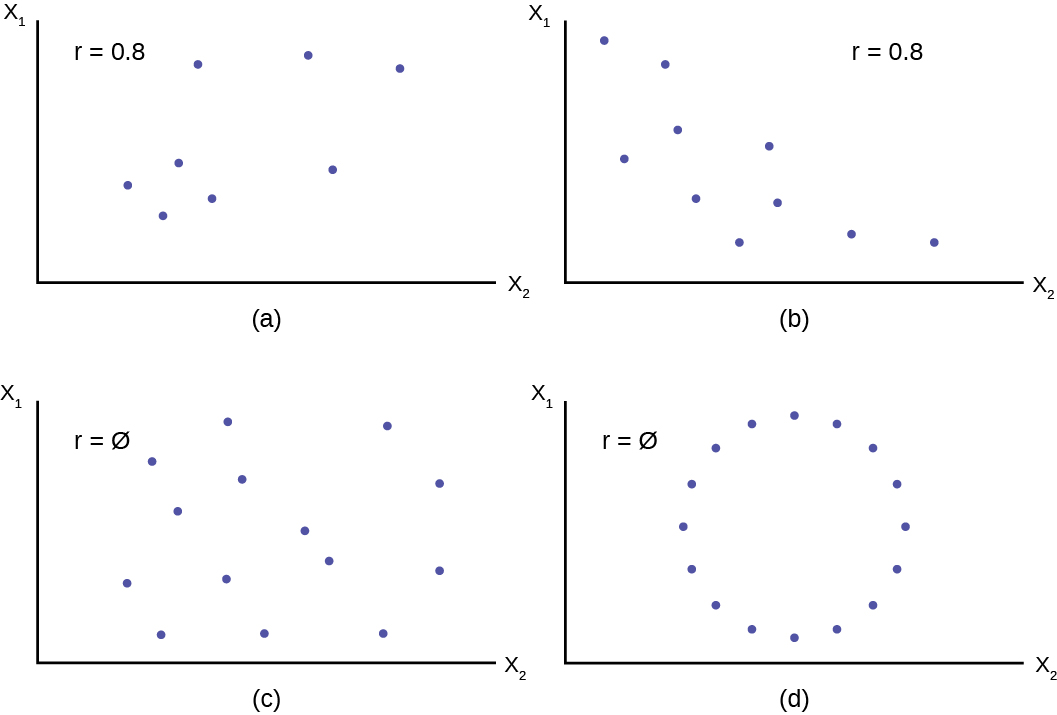
Remember, all the correlation coefficient tells us is whether or not the data are linearly related. In panel (d) the variables obviously have some type of very specific relationship to each other, but the correlation coefficient is zero, indicating no linear relationship exists.
If you suspect a linear relationship between X 1 and X 2 then r can measure how strong the linear relationship is.
Notification Switch
Would you like to follow the 'Introductory statistics' conversation and receive update notifications?

|
|

|
|

|
|

|
|

|
|
|
|
|

|
|

|
|

|
|

|