Linear Regression and Correlation: The Correlation Coefficient and Coefficient of Determination is a part of Collaborative Statistics collection (col10522) by Barbara Illowsky and Susan Dean with contributions from Roberta Bloom. The name has been changed from Correlation Coefficient.
The correlation coefficient r
Besides looking at the scatter plot and seeing that a line seems reasonable, how can you
tell if the line is a good predictor? Use the correlation coefficient as another indicator(besides the scatterplot) of the strength of the relationship between
and
.
The
correlation coefficient, r, developed by Karl Pearson in the early 1900s, is a numerical measure of the strength of association between the independent variable x and the dependent variable y.
The correlation coefficient is calculated as
where
= the number of data points.
If you suspect a linear relationship between
and
, then
can measure how strong the linear relationship is.
What the value of r tells us:
The value of
is always between -1 and +1:
.
The size of the correlation
indicates the strength of the linear relationship between
and
. Values of
close to -1 or to +1 indicate a stronger linear relationship between
and
.
If
there is absolutely no linear relationship between
and
(no linear correlation) .
If
, there is perfect positive correlation. If
, there is perfect negative
correlation. In both these cases, all of the original data points lie on a straight line. Of course,in the real world, this will not generally happen.
What the sign of r tells us
A positive value of
means that when
increases,
tends to increase and when
decreases,
tends to decrease
(positive correlation) .
A negative value of
means that when
increases,
tends to decrease and when
decreases,
tends to increase
(negative correlation) .
The sign of
is the same as the sign of the slope,
,
of the best fit line.
Strong correlation does not suggest that
causes
or
causes
. We say
"correlation does not imply causation." For example, every person who learned
math in the 17th century is dead. However, learning math does not necessarily causedeath!
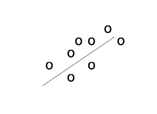
Positive correlation
A scatter plot showing data with a positive correlation.
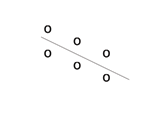
Negative correlation
A scatter plot showing data with a negative correlation.
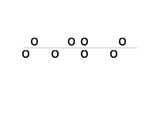
Zero correlation
A scatter plot showing data with zero correlation.
=0
The formula for
looks formidable. However, computer spreadsheets, statistical software, and many calculators can quickly calculate
. The correlation coefficient
is the bottom item in the output screens for the LinRegTTest on the TI-83, TI-83+, or TI-84+ calculator (see previous section for instructions).
The coefficient of determination
is called the coefficient of determination.
is the square of the correlation coefficient , but is usually stated as a percent, rather than in decimal form.
has an interpretation in the context of the data:
, when expressed as a percent, represents the percent of variation in the dependent variable y that can be explained by variation in the independent variable x using the regression (best fit) line.
1-
, when expressed as a percent, represents the percent of variation in y that is NOT explained by variation in x using the regression line. This can be seen as the scattering of the observed data points about the regression line.
Approximately 44% of the variation (0.4397 is approximately 0.44) in the final exam grades can be explained by the variation in the grades on the third exam, using the best fit regression line.
Therefore approximately 56% of the variation (1 - 0.44 = 0.56) in the final exam grades can NOT be explained by the variation in the grades on the third exam, using the best fit regression line. (This is seen as the scattering of the points about the line.)
The lymphatic system plays several crucial roles in the human body, functioning as a key component of the immune system and contributing to the maintenance of fluid balance. Its main functions include:
1. Immune Response: The lymphatic system produces and transports lymphocytes, which are a type of
asegid
to transport fluids fats proteins and lymphocytes to the blood stream as lymph
Anatomy is the study of the structure of the body, while physiology is the study of the function of the body. Anatomy looks at the body's organs and systems, while physiology looks at how those organs and systems work together to keep the body functioning.
Enzymes are proteins that help speed up chemical reactions in our bodies. Enzymes are essential for digestion, liver function and much more. Too much or too little of a certain enzyme can cause health problems
Kamara
yes
Prince
how does the stomach protect itself from the damaging effects of HCl
the normal temperature is 37°c or 98.6 °Fahrenheit is important for maintaining the homeostasis in the body
the body regular this temperature through the process called thermoregulation which involves brain skin muscle and other organ working together to maintain stable internal temperature