

| << Chapter < Page | Chapter >> Page > |
Frequency Distribution: Introduction
You can use Excel or Google Spreadsheet to construct a frequency distribution from a list of data. The frequency distribution for categorical data is by categories. For measurement data, the use of “binning” the data precedes the process of constructing a frequency distribution. Each bin acts like a separate category into which we can pour the appropriate individual data values. Correct interpretation of a frequency distribution requires that you know this important principle: Bins for measurement data (classes) are based on upper class limits.
With large data sets one will want to use the power of Excel or Google Spreadsheet to do the work once you understand the basic principles. We will demonstrate two processes to create frequency distributions. Using Excel or Google Spreadsheet you can create frequency distributions of categorical data by creating “countif” formulas or using the “pivot chart” function in Excel or “pivot table” function in Google Spreadsheet.
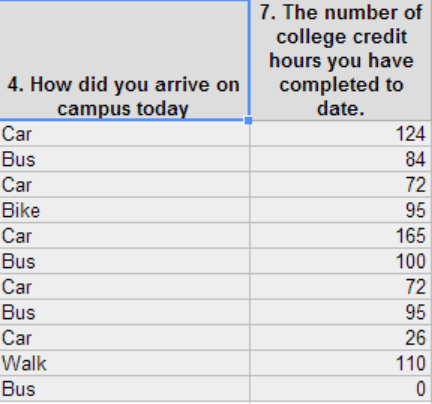
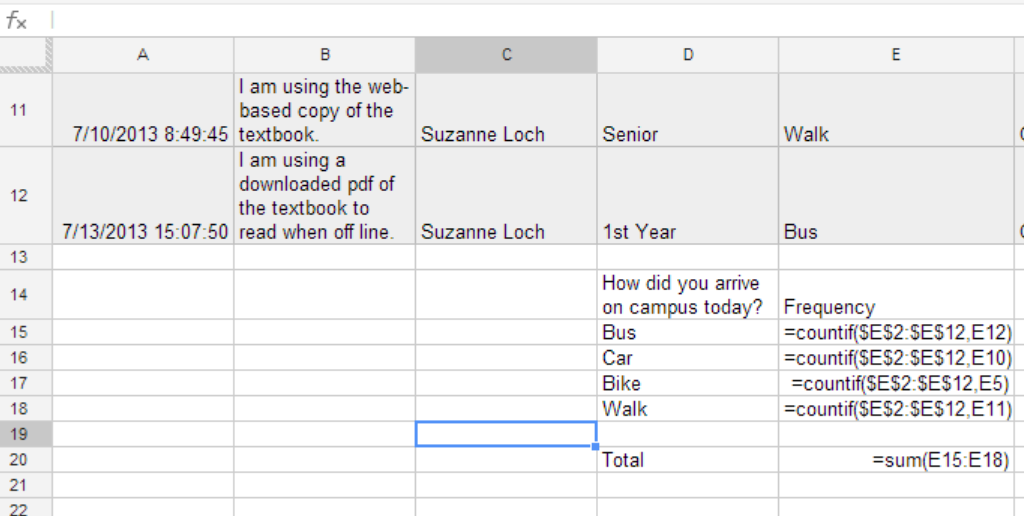
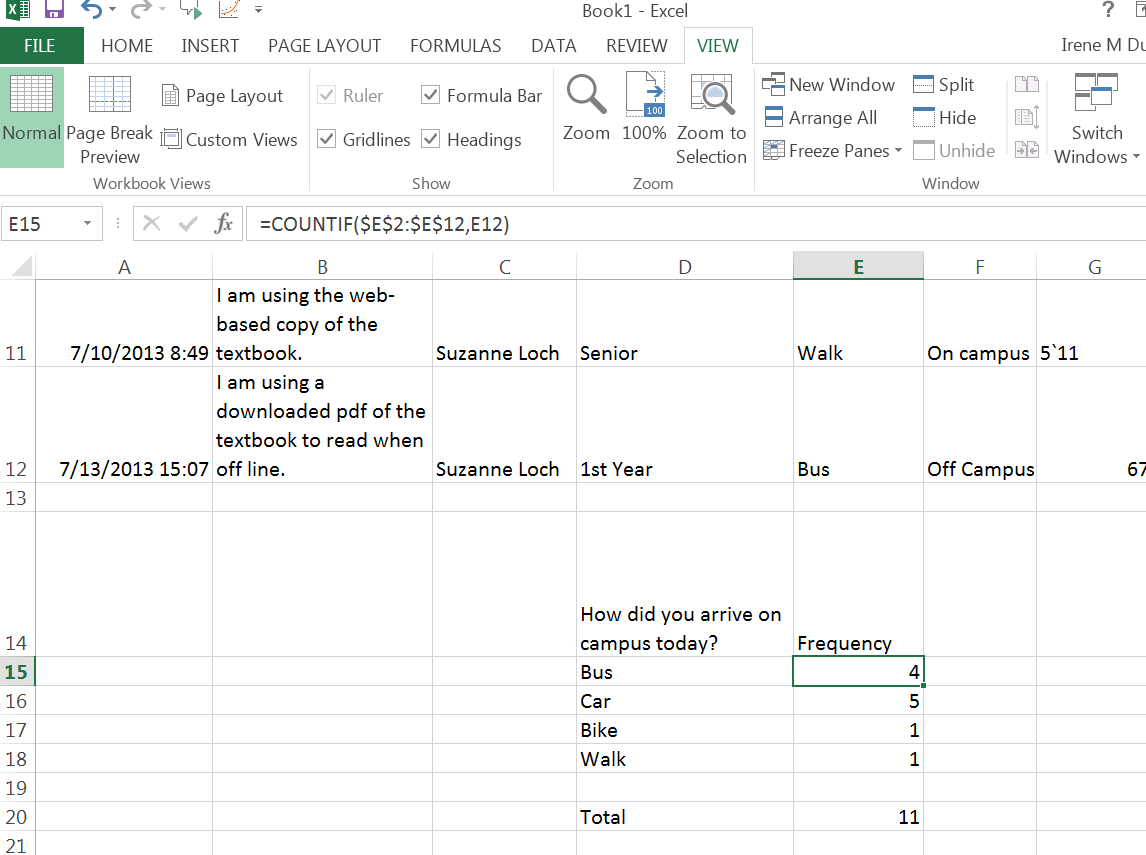
Countif: Countif is a formula that will count cells that contain information that meets the criteria you set in the formula. To enter the countif formula you will need to enter =countif(beginning cell address:end cell address, criteria) so if you want to count the number of people that rode the bus to campus today, you would type into an empty cell =countif(e2:e12,e12). The first two cell addresses indicate the beginning and the end of the column of data that you want to count bus usage separated by a colon sign. The third cell address indicates the criteria or in this case the term Bus. I can copy and paste this formula for walk, car, and bike only if I add in absolute reference into the formula and change the criteria to match the type of transportation of my choice. Try it with your sample data. You will not want a spreadsheet with a list of numbers without knowing what the data means or represents. See the example below demonstrating how to organized data so that you know what your table represents. The Google Spreadsheet has the formulas displayed. The Excel Spreadsheet has the values displayed. There is also a total indicated on the page. The total is produced by entering another formula =sum(beginning cell address: end cell address) in this case you will see that I summed e15 to e18 for a total of 11. If you check back to the cells 2 through 12 which you can do by entering =counta(e2:e12). It will give you the total count of non-empty cells with words or letters of the alphabet. If you type =count (e2:e12) it will give you the number of cells with numbers in the cells. In this case it will be 0 since we have words not numbers.
Now that we have the frequency distribution of a set of categorical data, we can calculate the relative frequency by creating a third column of data and labeling it relative frequency. For relative frequency we will need to take the frequency of each category and divide it by the total number of students polled. Here we will enter the formula =e15/$e$20, a simple division for my first entry “Bus”. Note that I have used the dollar sign to indicate that this is the sum that I want to use for all my data. It is fixed or absolute if you copy the formula to a new cell the e15 will change as I move down the list. Again a copy of the Google Spreadsheet with the formulas shown and the Excel spreadsheet with the results shown is listed below.
Notification Switch
Would you like to follow the 'Collaborative statistics using spreadsheets' conversation and receive update notifications?

|
|

|
|

|
|

|
|

|
|
|
|
|

|
|

|
|

|
|

|