<< Chapter < Page Chapter >> Page >
Basic directions on how to use Google Spreadsheet and Excel to explore and summarize data.

Getting started with spreadsheets

In this section we will discuss techniques using spreadsheet for inspecting quantitative and qualitative data particularly for summarizing frequency, relative frequency and cumulative relative frequency. We will primarily use Microsoft Excel and Google Spreadsheet, as we will use these two resources for sampling and surveying in this introductory course. We will also introduce Google Fusion for a quick look at data found on the internet. First let’s explore the components of most spreadsheet programs.

Common characteristics of spreadsheets

Most spreadsheets have some characteristics in common. They have a Ribbon and commands at the top of the file, a series of columns identified by the alphabet and a series of rows identified by the counting numbers, a formula bar , and a space at the bottom of the page for “ worksheets ” within the file or notebook. Below is a screenshot of Excel 2013 and Google Spreadsheet (found in Google Drive). Again if you are using a different version of either of these products, directions may vary but the concepts will be the same. Please note that the Excel ribbon contains 8 tabs: File, Home, Insert, Page Layout, Formulas, Data, Review, and View. Google Spreadsheet contains 8 tabs also File, Edit, View, Insert, Format, Data, Tools, and Help. I will draw you attention to these tabs as we proceed.

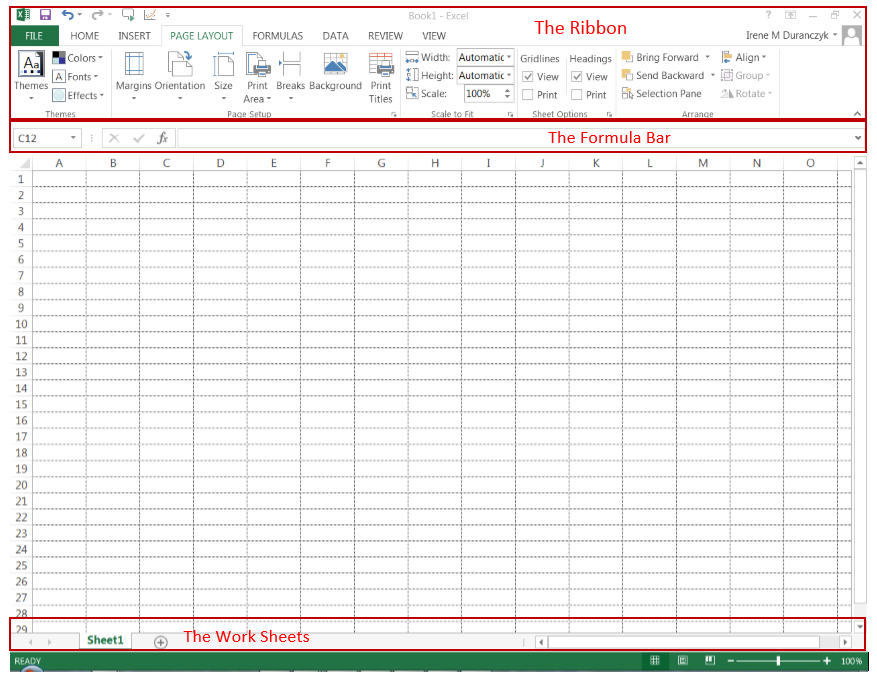
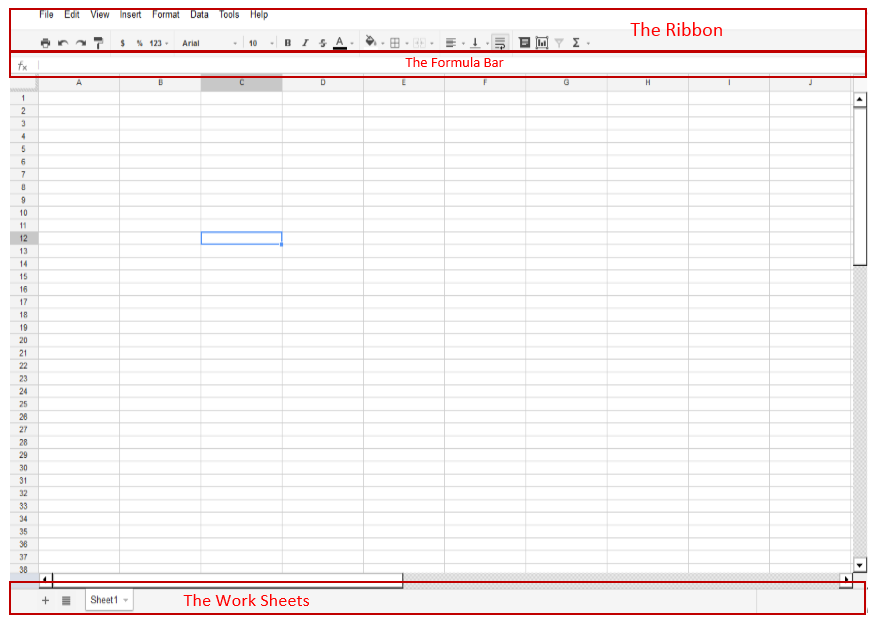
Although the ribbons at the top appear quite different, they both contain the same elements, such as File, View, Insert, Data, and Help. Many of the other functions that they have in common are “housed” in other pull down menus on the ribbon. Both spreadsheets will allow us to add data cells, label data columns and rows, calculate frequency, relative frequency, cumulative relative frequency, and create graphs and charts based on our data summaries. Let’s get started!

Prepatory work for summarizing data with excel and google spreadsheet

Downloading data from Moodle: We will begin our use of a spreadsheet by using a file of data supplied by your instructor. This file will contain rows and columns. The first row will have the titles of each of the columns. The first column will be individual data cases, the other columns will be either quantitative (discrete or continuous) or qualitative data (ordinal and nominal). To move a file from the course shell to Excel you will:

  1. Locate the file you want to download from the server or the course management system. If you click on the file it will either download or open in Excel or Google Spreadsheet. When you have opened the file in Excel. Go to step 2.
  2. Save the file to your local computer file space, your thumb drive, dropbox, or another cloud storage space. If you are not using a remote storage space, email the saved file to yourself at the end of the class session since individual computers may not store your data after you log out. Be sure to give your file a name that includes your first and last name. It is difficult for an instructor to keep track of files when all students have labeled files exactly the same. Your file name should include your identity and the assignment title. For, instance: samplinganddataIreneDuranczyk.xlx. NOTE: If you do not download the file and save the file first, your data may be lost or you may not be able to edit your data. Once you have saved the file continue with this guided lesson.

Questions & Answers

what is mutation
Janga Reply
what is a cell
Sifune Reply
how is urine form
Sifune
what is antagonism?
mahase Reply
classification of plants, gymnosperm features.
Linsy Reply
what is the features of gymnosperm
Linsy
how many types of solid did we have
Samuel Reply
what is an ionic bond
Samuel
What is Atoms
Daprince Reply
what is fallopian tube
Merolyn
what is bladder
Merolyn
what's bulbourethral gland
Eduek Reply
urine is formed in the nephron of the renal medulla in the kidney. It starts from filtration, then selective reabsorption and finally secretion
onuoha Reply
State the evolution relation and relevance between endoplasmic reticulum and cytoskeleton as it relates to cell.
Jeremiah
what is heart
Konadu Reply
how is urine formed in human
Konadu
how is urine formed in human
Rahma
what is the diference between a cavity and a canal
Pelagie Reply
what is the causative agent of malaria
Diamond
malaria is caused by an insect called mosquito.
Naomi
Malaria is cause by female anopheles mosquito
Isaac
Malaria is caused by plasmodium Female anopheles mosquitoe is d carrier
Olalekan
a canal is more needed in a root but a cavity is a bad effect
Commander
what are pathogens
Don Reply
In biology, a pathogen (Greek: πάθος pathos "suffering", "passion" and -γενής -genēs "producer of") in the oldest and broadest sense, is anything that can produce disease. A pathogen may also be referred to as an infectious agent, or simply a germ. The term pathogen came into use in the 1880s.[1][2
Zainab
A virus
Commander
Definition of respiration
Muhsin Reply
respiration is the process in which we breath in oxygen and breath out carbon dioxide
Achor
how are lungs work
Commander
where does digestion begins
Achiri Reply
in the mouth
EZEKIEL
what are the functions of follicle stimulating harmones?
Rashima Reply
stimulates the follicle to release the mature ovum into the oviduct
Davonte
what are the functions of Endocrine and pituitary gland
Chinaza
endocrine secrete hormone and regulate body process
Achor
while pituitary gland is an example of endocrine system and it's found in the Brain
Achor
what's biology?
Egbodo Reply
Biology is the study of living organisms, divided into many specialized field that cover their morphology, physiology,anatomy, behaviour,origin and distribution.
Lisah
biology is the study of life.
Alfreda
Biology is the study of how living organisms live and survive in a specific environment
Sifune
Got questions? Join the online conversation and get instant answers!
Jobilize.com Reply

Get Jobilize Job Search Mobile App in your pocket Now!

Get it on Google Play Download on the App Store Now


Source:  OpenStax, Collaborative statistics using spreadsheets. OpenStax CNX. Jan 05, 2016 Download for free at http://legacy.cnx.org/content/col11521/1.23
Google Play and the Google Play logo are trademarks of Google Inc.

Notification Switch

Would you like to follow the 'Collaborative statistics using spreadsheets' conversation and receive update notifications?

Ask