

| << Chapter < Page | Chapter >> Page > |
Whether analog or digital, information is represented by the fundamental quantity in electrical engineering: the signal . Stated in mathematical terms, a signal is merely a function . Analog signals are continuous-valued; digital signals are discrete-valued. Theindependent variable of the signal could be time (speech, for example), space (images), or the integers (denoting thesequencing of letters and numbers in the football score).
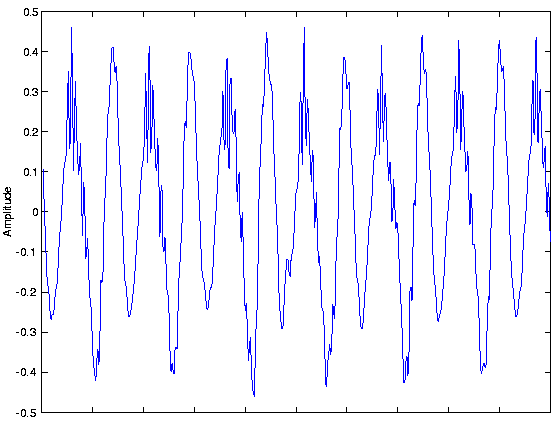
Analog signals are usually signals defined over continuous independent variable(s) . Speech is produced by your vocal cords exciting acoustic resonancesin your vocal tract. The result is pressure waves propagating in the air, and the speech signal thus corresponds to afunction having independent variables of space and time and a value corresponding to air pressure: (Here we use vector notation to denote spatial coordinates). When you record someone talking, you are evaluating the speech signal at a particularspatial location, say. An example of the resulting waveform is shown in this figure .
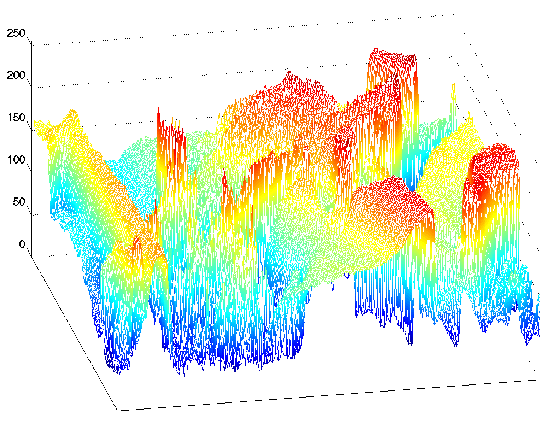
Photographs are static, and are continuous-valued signals defined over space. Black-and-white images have only one valueat each point in space, which amounts to its optical reflection properties. In [link] , an image is shown, demonstrating that it (and all other images as well) arefunctions of two independent spatial variables.

Color images have values that express how reflectivity depends on the optical spectrum. Painters long ago found that mixingtogether combinations of the so-called primary colors--red, yellow and blue--can produce very realistic color images.Thus, images today are usually thought of as having three values at every point in space, but a different set of colorsis used: How much of red, green and blue is present. Mathematically, color pictures aremultivalued--vector-valued--signals: .
Interesting cases abound where the analog signal depends not on a continuous variable, such as time, but on a discretevariable. For example, temperature readings taken every hour have continuous--analog--values, but the signal's independentvariable is (essentially) the integers.
The word "digital" means discrete-valued and implies the signal has an integer-valued independent variable. Digital informationincludes numbers and symbols (characters typed on the keyboard, for example). Computers rely on the digital representation ofinformation to manipulate and transform information. Symbols do not havea numeric value, and each is represented by a unique number. The ASCII character code has the upper- and lowercasecharacters, the numbers, punctuation marks, and various other symbols represented by a seven-bit integer.For example, the ASCII code represents the letter a as the number and the letter A as . [link] shows the international convention on associating characters withintegers.
| 00 | nul | 01 | soh | 02 | stx | 03 | etx | 04 | eot | 05 | enq | 06 | ack | 07 | bel |
| 08 | bs | 09 | ht | 0A | nl | 0B | vt | 0C | np | 0D | cr | 0E | so | 0F | si |
| 10 | dle | 11 | dc1 | 12 | dc2 | 13 | dc3 | 14 | dc4 | 15 | nak | 16 | syn | 17 | etb |
| 18 | car | 19 | em | 1A | sub | 1B | esc | 1C | fs | 1D | gs | 1E | rs | 1F | us |
| 20 | sp | 21 | ! | 22 | " | 23 | # | 24 | $ | 25 | % | 26 | & | 27 | ' |
| 28 | ( | 29 | ) | 2A | * | 2B | + | 2C | , | 2D | - | 2E | . | 2F | / |
| 30 | 0 | 31 | 1 | 32 | 2 | 33 | 3 | 34 | 4 | 35 | 5 | 36 | 6 | 37 | 7 |
| 38 | 8 | 39 | 9 | 3A | : | 3B | ; | 3C | < | 3D | = | 3E | > | 3F | ? |
| 40 | @ | 41 | A | 42 | B | 43 | C | 44 | D | 45 | E | 46 | F | 47 | G |
| 48 | H | 49 | I | 4A | J | 4B | K | 4C | L | 4D | M | 4E | N | 4F | 0 |
| 50 | P | 51 | Q | 52 | R | 53 | S | 54 | T | 55 | U | 56 | V | 57 | W |
| 58 | X | 59 | Y | 5A | Z | 5B | [ | 5C | \ | 5D | ] | 5E | ^ | 5F | _ |
| 60 | ' | 61 | a | 62 | b | 63 | c | 64 | d | 65 | e | 66 | f | 67 | g |
| 68 | h | 69 | i | 6A | j | 6B | k | 6C | l | 6D | m | 6E | n | 6F | o |
| 70 | p | 71 | q | 72 | r | 73 | s | 74 | t | 75 | u | 76 | v | 77 | w |
| 78 | x | 79 | y | 7A | z | 7B | { | 7C | | | 7D | } | 7E | ~ | 7F | del |
Notification Switch
Would you like to follow the 'Fundamentals of electrical engineering i' conversation and receive update notifications?

|
|

|
|

|
|

|
|

|
|

|
|
|
|
|

|
|

|
|

|