<< Chapter < Page Chapter >> Page >

Biofilm formation

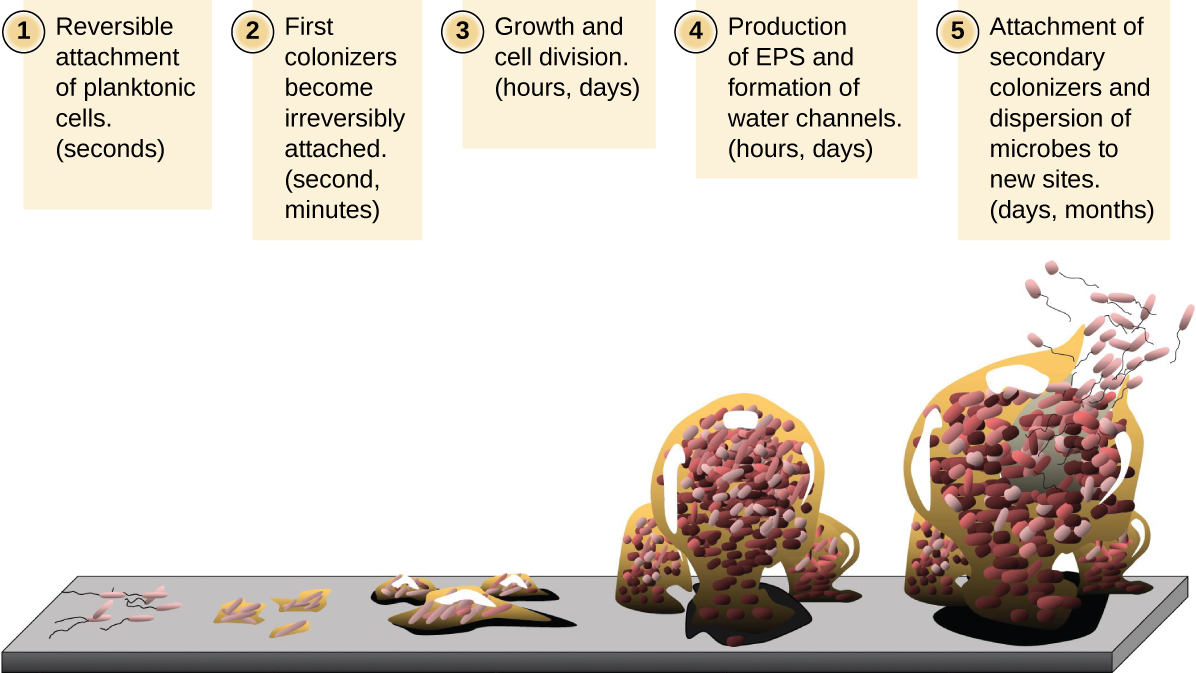
Free-floating microbial cells that live in an aquatic environment are called planktonic cells. The formation of a biofilm essentially involves the attachment of planktonic cells to a substrate, where they become sessile (attached to a surface). This occurs in stages, as depicted in [link] . The first stage involves the attachment of planktonic cells to a surface coated with a conditioning film of organic material. At this point, attachment to the substrate is reversible, but as cells express new phenotypes that facilitate the formation of EPS, they transition from a planktonic to a sessile lifestyle. The biofilm develops characteristic structures, including an extensive matrix and water channels. Appendages such as fimbriae , pili , and flagella interact with the EPS, and microscopy and genetic analysis suggest that such structures are required for the establishment of a mature biofilm. In the last stage of the biofilm life cycle, cells on the periphery of the biofilm revert to a planktonic lifestyle, sloughing off the mature biofilm to colonize new sites. This stage is referred to as dispersal .

Diagram of the formation of a biofilm. Step 1 – the reversible attachment of planktonic cells (seconds). This is shown as a few cells with flagella attaching to a surface. Step 2 – the first colonizers become irreversibly attached (seconds to minutes). This is shown as small clusters of cells on the surface. Step 3 – Growth and cell division (hours, days). This is shown as larger clusters on the surface. Step 4 – Production of EPS and formation of water channels (hours, days). This is shown as very large clusters. Step 5 – Attachment of secondary colonizers and dispersion of microbes to new sites (days, months). This is shown as small flagellated cells leaving from the very large cluster.
Stages in the formation and life cycle of a biofilm. (credit: modification of work by Public Library of Science and American Society for Microbiology)

Within a biofilm, different species of microorganisms establish metabolic collaborations in which the waste product of one organism becomes the nutrient for another. For example, aerobic microorganisms consume oxygen, creating anaerobic regions that promote the growth of anaerobes. This occurs in many polymicrobial infections that involve both aerobic and anaerobic pathogens.

The mechanism by which cells in a biofilm coordinate their activities in response to environmental stimuli is called quorum sensing . Quorum sensing—which can occur between cells of different species within a biofilm—enables microorganisms to detect their cell density through the release and binding of small, diffusible molecules called autoinducers . When the cell population reaches a critical threshold (a quorum), these autoinducers initiate a cascade of reactions that activate genes associated with cellular functions that are beneficial only when the population reaches a critical density. For example, in some pathogens, synthesis of virulence factors only begins when enough cells are present to overwhelm the immune defenses of the host. Although mostly studied in bacterial populations, quorum sensing takes place between bacteria and eukaryotes and between eukaryotic cells such as the fungus Candida albicans , a common member of the human microbiota that can cause infections in immunocompromised individuals.

The signaling molecules in quorum sensing belong to two major classes. Gram-negative bacteria communicate mainly using N-acylated homoserine lactones, whereas gram-positive bacteria mostly use small peptides ( [link] ). In all cases, the first step in quorum sensing consists of the binding of the autoinducer to its specific receptor only when a threshold concentration of signaling molecules is reached. Once binding to the receptor takes place, a cascade of signaling events leads to changes in gene expression. The result is the activation of biological responses linked to quorum sensing, notably an increase in the production of signaling molecules themselves, hence the term autoinducer.

Questions & Answers

how do you get the 2/50
Abba Reply
number of sport play by 50 student construct discrete data
Aminu Reply
width of the frangebany leaves on how to write a introduction
Theresa Reply
Solve the mean of variance
Veronica Reply
Step 1: Find the mean. To find the mean, add up all the scores, then divide them by the number of scores. ... Step 2: Find each score's deviation from the mean. ... Step 3: Square each deviation from the mean. ... Step 4: Find the sum of squares. ... Step 5: Divide the sum of squares by n – 1 or N.
kenneth
what is error
Yakuba Reply
Is mistake done to something
Vutshila
Hy
anas
hy
What is the life teble
anas
hy
Jibrin
statistics is the analyzing of data
Tajudeen Reply
what is statics?
Zelalem Reply
how do you calculate mean
Gloria Reply
diveving the sum if all values
Shaynaynay
let A1,A2 and A3 events be independent,show that (A1)^c, (A2)^c and (A3)^c are independent?
Fisaye Reply
what is statistics
Akhisani Reply
data collected all over the world
Shaynaynay
construct a less than and more than table
Imad Reply
The sample of 16 students is taken. The average age in the sample was 22 years with astandard deviation of 6 years. Construct a 95% confidence interval for the age of the population.
Aschalew Reply
Bhartdarshan' is an internet-based travel agency wherein customer can see videos of the cities they plant to visit. The number of hits daily is a normally distributed random variable with a mean of 10,000 and a standard deviation of 2,400 a. what is the probability of getting more than 12,000 hits? b. what is the probability of getting fewer than 9,000 hits?
Akshay Reply
Bhartdarshan'is an internet-based travel agency wherein customer can see videos of the cities they plan to visit. The number of hits daily is a normally distributed random variable with a mean of 10,000 and a standard deviation of 2,400. a. What is the probability of getting more than 12,000 hits
Akshay
1
Bright
Sorry i want to learn more about this question
Bright
Someone help
Bright
a= 0.20233 b=0.3384
Sufiyan
a
Shaynaynay
How do I interpret level of significance?
Mohd Reply
It depends on your business problem or in Machine Learning you could use ROC- AUC cruve to decide the threshold value
Shivam
how skewness and kurtosis are used in statistics
Owen Reply
yes what is it
Taneeya
Got questions? Join the online conversation and get instant answers!
Jobilize.com Reply

Get Jobilize Job Search Mobile App in your pocket Now!

Get it on Google Play Download on the App Store Now


Source:  OpenStax, Microbiology. OpenStax CNX. Nov 01, 2016 Download for free at http://cnx.org/content/col12087/1.4
Google Play and the Google Play logo are trademarks of Google Inc.

Notification Switch

Would you like to follow the 'Microbiology' conversation and receive update notifications?

Ask