

| << Chapter < Page | Chapter >> Page > |
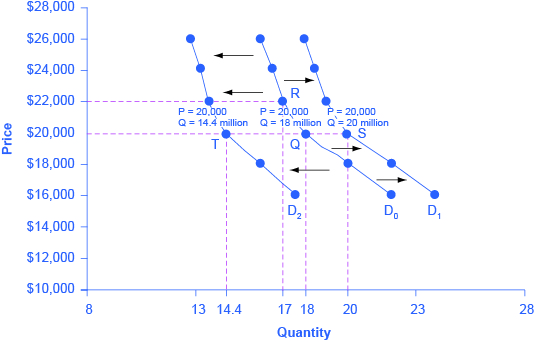
Let’s use income as an example of how factors other than price affect demand. [link] shows the initial demand for automobiles as D 0 . At point Q, for example, if the price is $20,000 per car, the quantity of cars demanded is 18 million. D 0 also shows how the quantity of cars demanded would change as a result of a higher or lower price. For example, if the price of a car rose to $22,000, the quantity demanded would decrease to 17 million, at point R.
The original demand curve D 0 , like every demand curve, is based on the ceteris paribus assumption that no other economically relevant factors change. Now imagine that the economy expands in a way that raises the incomes of many people, making cars more affordable. How will this affect demand? How can we show this graphically?
Return to [link] . The price of cars is still $20,000, but with higher incomes, the quantity demanded has now increased to 20 million cars, shown at point S. As a result of the higher income levels, the demand curve shifts to the right to the new demand curve D 1 , indicating an increase in demand. [link] shows clearly that this increased demand would occur at every price, not just the original one.
| Price | Decrease to D 2 | Original Quantity Demanded D 0 | Increase to D 1 |
|---|---|---|---|
| $16,000 | 17.6 million | 22.0 million | 24.0 million |
| $18,000 | 16.0 million | 20.0 million | 22.0 million |
| $20,000 | 14.4 million | 18.0 million | 20.0 million |
| $22,000 | 13.6 million | 17.0 million | 19.0 million |
| $24,000 | 13.2 million | 16.5 million | 18.5 million |
| $26,000 | 12.8 million | 16.0 million | 18.0 million |
Now, imagine that the economy slows down so that many people lose their jobs or work fewer hours, reducing their incomes. In this case, the decrease in income would lead to a lower quantity of cars demanded at every given price, and the original demand curve D 0 would shift left to D 2 . The shift from D 0 to D 2 represents such a decrease in demand: At any given price level, the quantity demanded is now lower. In this example, a price of $20,000 means 18 million cars sold along the original demand curve, but only 14.4 million sold after demand fell.
When a demand curve shifts, it does not mean that the quantity demanded by every individual buyer changes by the same amount. In this example, not everyone would have higher or lower income and not everyone would buy or not buy an additional car. Instead, a shift in a demand curve captures an pattern for the market as a whole.
In the previous section, we argued that higher income causes greater demand at every price. This is true for most goods and services. For some—luxury cars, vacations in Europe, and fine jewelry—the effect of a rise in income can be especially pronounced. A product whose demand rises when income rises, and vice versa, is called a normal good . A few exceptions to this pattern do exist. As incomes rise, many people will buy fewer generic brand groceries and more name brand groceries. They are less likely to buy used cars and more likely to buy new cars. They will be less likely to rent an apartment and more likely to own a home, and so on. A product whose demand falls when income rises, and vice versa, is called an inferior good . In other words, when income increases, the demand curve shifts to the left.
Notification Switch
Would you like to follow the 'Macroeconomics' conversation and receive update notifications?

|
|
|
|
|

|
|
|
|
|

|
|

|
|

|
|

|
|

|
|

|
|

|
|
|
|