

| << Chapter < Page | Chapter >> Page > |
By the time of the 1876 presidential election, Reconstruction had come to an end in most southern states. In Congress, the political power of the Radical Republicans had waned, although some continued their efforts to realize the dream of equality between blacks and whites. One of the last attempts to do so was the passage of the 1875 Civil Rights Act, which required equality in public places and on juries. This law was challenged in court, and in 1883 the Supreme Court ruled it unconstitutional, arguing that the Thirteenth and Fourteenth Amendments did not prohibit discrimination by private individuals. By the 1870s, the Supreme Court had also undercut the letter and the spirit of the Fourteenth Amendment by interpreting it as affording freed people only limited federal protection from the Klan and other terror groups.
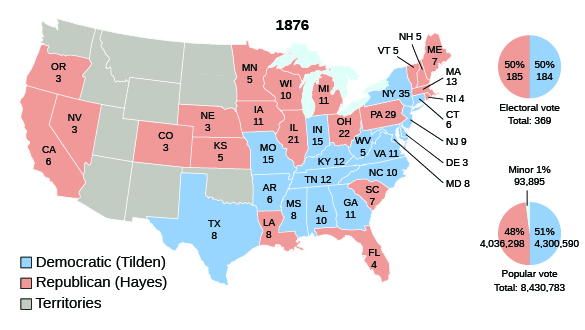
The country remained bitterly divided, and this was reflected in the contested election of 1876. While Grant wanted to run for a third term, scandals and Democratic successes in the South dashed those hopes. Republicans instead selected Rutherford B. Hayes, the three-time governor of Ohio. Democrats nominated Samuel Tilden, the reform governor of New York, who was instrumental in ending the Tweed Ring and Tammany Hall corruption in New York City. The November election produced an apparent Democratic victory, as Tilden carried the South and large northern states with a 300,000-vote advantage in the popular vote. However, disputed returns from Louisiana, South Carolina, Florida, and Oregon, whose electoral votes totaled twenty, threw the election into doubt.
Hayes could still win if he gained those twenty electoral votes. As the Constitution did not provide a method to determine the validity of disputed votes, the decision fell to Congress, where Republicans controlled the Senate and Democrats controlled the House of Representatives. In late January 1877, Congress tried to break the deadlock by creating a special electoral commission composed of five senators, five representatives, and five justices of the Supreme Court. The congressional delegation represented both parties equally, with five Democrats and five Republicans. The court delegation had two Democrats, two Republicans, and one independent—David Davis, who resigned from the Supreme Court (and from the commission) when the Illinois legislature elected him to the Senate. After Davis’s resignation, President Grant selected a Republican to take his place, tipping the scales in favor of Hayes. The commission then awarded the disputed electoral votes and the presidency to Hayes, voting on party lines, 8 to 7 ( [link] ). The Democrats called foul, threatening to hold up the commission’s decision in the courts.
In what became known as the Compromise of 1877 , Republican Senate leaders worked with the Democratic leadership so they would support Hayes and the commission’s decision. The two sides agreed that one Southern Democrat would be appointed to Hayes’s cabinet, Democrats would control federal patronage (the awarding of government jobs) in their areas in the South, and there would be a commitment to generous internal improvements, including federal aid for the Texas and Pacific Railway. Perhaps most important, all remaining federal troops would be withdrawn from the South, a move that effectively ended Reconstruction. Hayes believed that southern leaders would obey and enforce the Reconstruction-era constitutional amendments that protected the rights of freed people. His trust was soon proved to be misguided, much to his dismay, and he devoted a large part of his life to securing rights for freedmen. For their part, the Democrats took over the remaining southern states, creating what became known as the “Solid South”—a region that consistently voted in a bloc for the Democratic Party.
The efforts launched by Radical Republicans in the late 1860s generated a massive backlash in the South in the 1870s as whites fought against what they considered “negro misrule.” Paramilitary terrorist cells emerged, committing countless atrocities in their effort to “redeem” the South from black Republican rule. In many cases, these organizations operated as an extension of the Democratic Party. Scandals hobbled the Republican Party, as did a severe economic depression. By 1875, Reconstruction had largely come to an end. The contested presidential election the following year, which was decided in favor of the Republican candidate, and the removal of federal troops from the South only confirmed the obvious: Reconstruction had failed to achieve its primary objective of creating an interracial democracy that provided equal rights to all citizens.
Notification Switch
Would you like to follow the 'U.s. history' conversation and receive update notifications?

|
|
|
|
|

|
|

|
|

|
|

|
|

|
|

|
|
|
|
|

|
|

|
|

|