

| << Chapter < Page | Chapter >> Page > |
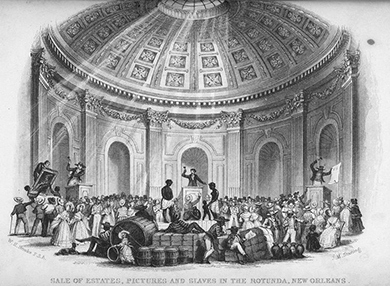
New Orleans had the largest slave market in the United States ( [link] ). Slaveholders brought their slaves there from the East (Virginia, Maryland, and the Carolinas) and the West (Tennessee and Kentucky) to be sold for work in the Mississippi Valley. The slave trade benefited whites in the Chesapeake and Carolinas, providing them with extra income: A healthy young male slave in the 1850s could be sold for $1,000 (approximately $30,000 in 2014 dollars), and a planter who could sell ten such slaves collected a windfall.
In fact, by the 1850s, the demand for slaves reached an all-time high, and prices therefore doubled. A slave who would have sold for $400 in the 1820s could command a price of $800 in the 1850s. The high price of slaves in the 1850s and the inability of natural increase to satisfy demands led some southerners to demand the reopening of the international slave trade, a movement that caused a rift between the Upper South and the Lower South. Whites in the Upper South who sold slaves to their counterparts in the Lower South worried that reopening the trade would lower prices and therefore hurt their profits.
A slave named John Brown lived in Virginia, North Carolina, and Georgia before he escaped and moved to England. While there, he dictated his autobiography to someone at the British and Foreign Anti-Slavery Society, who published it in 1855.
I really thought my mother would have died of grief at being obliged to leave her two children, her mother, and her relations behind. But it was of no use lamenting, the few things we had were put together that night, and we completed our preparations for being parted for life by kissing one another over and over again, and saying good bye till some of us little ones fell asleep. . . . And here I may as well tell what kind of man our new master was. He was of small stature, and thin, but very strong. He had sandy hair, a very red face, and chewed tobacco. His countenance had a very cruel expression, and his disposition was a match for it. He was, indeed, a very bad man, and used to flog us dreadfully. He would make his slaves work on one meal a day, until quite night, and after supper, set them to burn brush or spin cotton. We worked from four in the morning till twelve before we broke our fast, and from that time till eleven or twelve at night . . . we labored eighteen hours a day.
—John Brown, Slave Life in Georgia: A Narrative of the Life, Sufferings, and Escape of John Brown, A Fugitive Slave, Now in England , 1855
What features of the domestic slave trade does Brown’s narrative illuminate? Why do you think he brought his story to an antislavery society? How do you think people responded to this narrative?
Read through several narratives at “Born in Slavery,” part of the American Memory collection at the Library of Congress. Do these narratives have anything in common? What differences can you find between them?
Slave labor in the antebellum South generated great wealth for plantation owners. Slaves, in contrast, endured daily traumas as the human property of masters. Slaves resisted their condition in a variety of ways, and many found some solace in Christianity and the communities they created in the slave quarters. While some free blacks achieved economic prosperity and even became slaveholders themselves, the vast majority found themselves restricted by the same white-supremacist assumptions upon which the institution of slavery was based.
Notification Switch
Would you like to follow the 'U.s. history' conversation and receive update notifications?

|
|

|
|

|
|

|
|

|
|

|
|

|
|

|
|

|
|

|
|

|