<< Chapter < Page Chapter >> Page >

While a monopolist can charge any price for its product, that price is nonetheless constrained by demand for the firm’s product. No monopolist, even one that is thoroughly protected by high barriers to entry, can require consumers to purchase its product. Because the monopolist is the only firm in the market, its demand curve is the same as the market demand curve, which is, unlike that for a perfectly competitive firm, downward-sloping.

[link] illustrates this situation. The monopolist can either choose a point like R with a low price (Pl) and high quantity (Qh), or a point like S with a high price (Ph) and a low quantity (Ql), or some intermediate point. Setting the price too high will result in a low quantity sold, and will not bring in much revenue. Conversely, setting the price too low may result in a high quantity sold, but because of the low price, it will not bring in much revenue either. The challenge for the monopolist is to strike a profit-maximizing balance between the price it charges and the quantity that it sells. But why isn’t the perfectly competitive firm’s demand curve also the market demand curve? See the following Clear it Up feature for the answer to this question.

What is the difference between perceived demand and market demand?

The demand curve as perceived by a perfectly competitive firm is not the overall market demand curve for that product. However, the firm’s demand curve as perceived by a monopoly is the same as the market demand curve. The reason for the difference is that each perfectly competitive firm perceives the demand for its products in a market that includes many other firms; in effect, the demand curve perceived by a perfectly competitive firm is a tiny slice of the entire market demand curve. In contrast, a monopoly perceives demand for its product in a market where the monopoly is the only producer.

Total cost and total revenue for a monopolist

Profits for a monopolist can be illustrated with a graph of total revenues and total costs, as shown with the example of the hypothetical HealthPill firm in [link] . The total cost curve has its typical shape; that is, total costs rise and the curve grows steeper as output increases.
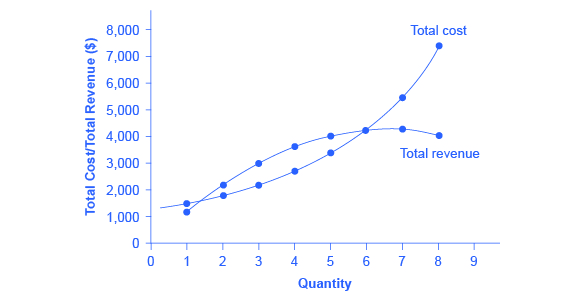
Total revenue and total cost for the healthpill monopoly

The graph shows total cost as an upward-sloping line and total revenue as a curve that rises then falls. The two curves intersect at two different points.
Total revenue for the monopoly firm called HealthPill first rises, then falls. Low levels of output bring in relatively little total revenue, because the quantity is low. High levels of output bring in relatively less revenue, because the high quantity pushes down the market price. The total cost curve is upward-sloping. Profits will be highest at the quantity of output where total revenue is most above total cost. Of the choices in [link] , the highest profits happen at an output of 4. The profit-maximizing level of output is not the same as the revenue-maximizing level of output, which should make sense, because profits take costs into account and revenues do not.
Total costs and total revenues of healthpill
Quantity Total Cost Quantity Price Total Revenue Profit = Total Revenue – Total Cost
1 1,500 1 1,200 1,200 –300
2 1,800 2 1,100 2,200 400
3 2,200 3 1,000 3,000 800
4 2,800 4 900 3,600 800
5 3,500 5 800 4,000 500
6 4,200 6 700 4,200 0
7 5,600 7 600 4,200 –1,400
8 7,400 8 500 4,000 –3,400

Questions & Answers

what does mean opportunity cost?
Aster Reply
what is poetive effect of population growth
Solomon Reply
what is inflation
Nasir Reply
what is demand
Eleni
what is economics
IMLAN Reply
economics theory describes individual behavior as the result of a process of optimization under constraints the objective to be reached being determined by
Kalkidan
Economics is a branch of social science that deal with How to wise use of resource ,s
Kassie
need
WARKISA
Economic Needs: In economics, needs are goods or services that are necessary for maintaining a certain standard of living. This includes things like healthcare, education, and transportation.
Kalkidan
What is demand and supply
EMPEROR Reply
deman means?
Alex
what is supply?
Alex
ex play supply?
Alex
Money market is a branch or segment of financial market where short-term debt instruments are traded upon. The instruments in this market includes Treasury bills, Bonds, Commercial Papers, Call money among other.
murana Reply
good
Kayode
what is money market
umar Reply
Examine the distinction between theory of comparative cost Advantage and theory of factor proportion
Fatima Reply
What is inflation
Bright Reply
a general and ongoing rise in the level of prices in an economy
AI-Robot
What are the factors that affect demand for a commodity
Florence Reply
price
Kenu
differentiate between demand and supply giving examples
Lambiv Reply
differentiated between demand and supply using examples
Lambiv
what is labour ?
Lambiv
how will I do?
Venny Reply
how is the graph works?I don't fully understand
Rezat Reply
information
Eliyee
devaluation
Eliyee
t
WARKISA
hi guys good evening to all
Lambiv
multiple choice question
Aster Reply
appreciation
Eliyee
explain perfect market
Lindiwe Reply
In economics, a perfect market refers to a theoretical construct where all participants have perfect information, goods are homogenous, there are no barriers to entry or exit, and prices are determined solely by supply and demand. It's an idealized model used for analysis,
Ezea

Get Jobilize Job Search Mobile App in your pocket Now!

Get it on Google Play Download on the App Store Now


Source:  OpenStax, Principles of economics. OpenStax CNX. Sep 19, 2014 Download for free at http://legacy.cnx.org/content/col11613/1.11
Google Play and the Google Play logo are trademarks of Google Inc.

Notification Switch

Would you like to follow the 'Principles of economics' conversation and receive update notifications?

Ask