| << Chapter < Page | Chapter >> Page > |
The most common way price supports work is that the government enters the market and buys up the product, adding to demand to keep prices higher than they otherwise would be. According to the Common Agricultural Policy reform passed in 2013, the European Union (EU) will spend about 60 billion euros per year, or 67 billion dollars per year, or roughly 38% of the EU budget, on price supports for Europe’s farmers from 2014 to 2020.
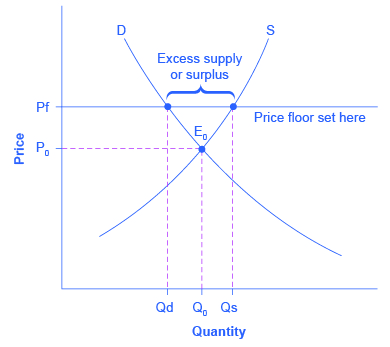
[link] illustrates the effects of a government program that assures a price above the equilibrium by focusing on the market for wheat in Europe. In the absence of government intervention, the price would adjust so that the quantity supplied would equal the quantity demanded at the equilibrium point E 0 , with price P 0 and quantity Q 0 . However, policies to keep prices high for farmers keeps the price above what would have been the market equilibrium level—the price Pf shown by the dashed horizontal line in the diagram. The result is a quantity supplied in excess of the quantity demanded (Qd). When quantity supplied exceeds quantity demanded, a surplus exists.
The high-income areas of the world, including the United States, Europe, and Japan, are estimated to spend roughly $1 billion per day in supporting their farmers. If the government is willing to purchase the excess supply (or to provide payments for others to purchase it), then farmers will benefit from the price floor, but taxpayers and consumers of food will pay the costs. Numerous proposals have been offered for reducing farm subsidies. In many countries, however, political support for subsidies for farmers remains strong. Either because this is viewed by the population as supporting the traditional rural way of life or because of the lobbying power of the agro-business industry.
For more detail on the effects price ceilings and floors have on demand and supply, see the following Clear It Up feature.

Neither price ceilings nor price floors cause demand or supply to change. They simply set a price that limits what can be legally charged in the market. Remember, changes in price do not cause demand or supply to change. Price ceilings and price floors can cause a different choice of quantity demanded along a demand curve, but they do not move the demand curve. Price controls can cause a different choice of quantity supplied along a supply curve, but they do not shift the supply curve.
Price ceilings prevent a price from rising above a certain level. When a price ceiling is set below the equilibrium price, quantity demanded will exceed quantity supplied, and excess demand or shortages will result. Price floors prevent a price from falling below a certain level. When a price floor is set above the equilibrium price, quantity supplied will exceed quantity demanded, and excess supply or surpluses will result. Price floors and price ceilings often lead to unintended consequences.
A low-income country decides to set a price ceiling on bread so it can make sure that bread is affordable to the poor. The conditions of demand and supply are given in [link] . What are the equilibrium price and equilibrium quantity before the price ceiling? What will the excess demand or the shortage (that is, quantity demanded minus quantity supplied) be if the price ceiling is set at $2.40? At $2.00? At $3.60?
| Price | Qd | Qs |
|---|---|---|
| $1.60 | 9,000 | 5,000 |
| $2.00 | 8,500 | 5,500 |
| $2.40 | 8,000 | 6,400 |
| $2.80 | 7,500 | 7,500 |
| $3.20 | 7,000 | 9,000 |
| $3.60 | 6,500 | 11,000 |
| $4.00 | 6,000 | 15,000 |

Notification Switch
Would you like to follow the 'Principles of economics' conversation and receive update notifications?