

| << Chapter < Page | Chapter >> Page > |
Although technology may be the most prominent example of a positive externality, it is not the only one. For example, being vaccinated against disease is not only a protection for the individual, but it has the positive spillover of protecting others who may become infected. When a number of homes in a neighborhood are modernized, updated, and restored, not only does it increase the value of those homes, but the value of other properties in the neighborhood may increase as well.
The appropriate public policy response to a positive externality, like a new technology, is to help the party creating the positive externality receive a greater share of the social benefits. In the case of vaccines, like flu shots, an effective policy might be to provide a subsidy to those who choose to get vaccinated.
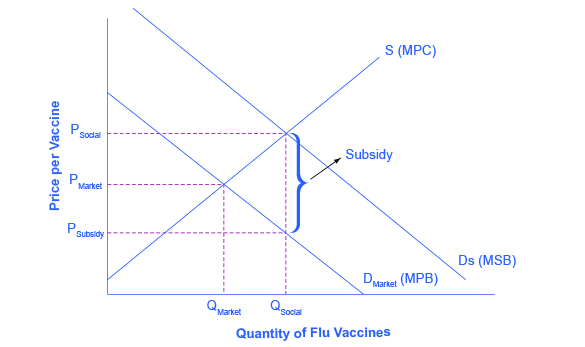
[link] shows the market for flu shots. The market demand curve D Market for flu shots reflects only the marginal private benefits (MPB) that the vaccinated individuals receive from the shots. Assuming that there are no spillover costs in the production of flu shots, the market supply curve is given by the marginal private cost (MPC) of producing the vaccinations.
The equilibrium quantity of flu shots produced in the market, where MPB is equal to MPC, is Q Market and the price of flu shots is P Market . However, spillover benefits exist in this market because others, those who chose not to purchase a flu shot, receive a positive externality in a reduced chance of contracting the flu. When we add the spillover benefits to the marginal private benefit of flu shots, the marginal social benefit (MSB) of flu shots is given by D Social . Because the MPB is greater than MSB, we see that the socially optimal level of flu shots is greater than the market quantity (Q Social exceeds Q Market ) and the corresponding price of flu shots, if the market were to produce Q Social , would be at P Social . Unfortunately, the marketplace does not recognize the positive externality and flu shots will go under produced and under consumed.
So how can government try to move the market level of output closer to the socially desirable level of output? One policy would be to provide a subsidy, like a voucher, to any citizen who wishes to get vaccinated. This voucher would act as “income” that could be used to purchase only a flu shot and, if the voucher was exactly equal to the per-unit spillover benefits, would increase market equilibrium to a quantity of Q Social and a price of P Social where MSB equals MSC. Suppliers of the flu shots would receive payment of P Social per vaccination, while consumers of flu shots would redeem the voucher and only pay a price of P Subsidy . When the government uses a subsidy in this way, the socially optimal quantity of vaccinations is produced.
Competition creates pressure to innovate. However, if new inventions can be easily copied, then the original inventor loses the incentive to invest further in research and development. New technology often has positive externalities; that is, there are often spillovers from the invention of new technology that benefit firms other than the innovator. The social benefit of an invention, once these spillovers are taken into account, typically exceeds the private benefit to the inventor. If inventors could receive a greater share of the broader social benefits for their work, they would have a greater incentive to seek out new inventions.
HighFlyer Airlines wants to build new airplanes with greatly increased cabin space. This will allow HighFlyer Airlines to give passengers more comfort and sell more tickets at a higher price. However, redesigning the cabin means rethinking many other elements of the airplane as well, like the placement of engines and luggage, and the most efficient shape of the plane for moving through the air. HighFlyer Airlines has developed a list of possible methods to increase cabin space, along with estimates of how these approaches would affect costs of operating the plane and sales of airline tickets. Based on these estimates, [link] shows the value of R&D projects that provide at least a certain private rate of return. Column 1 = Private Rate of Return. Column 2 = Value of R&D Projects that Return at Least the Private Rate of Return to HighFlyer Airlines. Use the data to answer the following questions.
| Private Rate of Return | Value of R&D |
|---|---|
| 12% | $100 |
| 10% | $200 |
| 8% | $300 |
| 6% | $400 |
| 4% | $500 |
Arias, Omar and Walter W. McMahon. “Dynamic Rates of Return to Education in the U.S.” Economics of Education Review . 20, 2001. 121–138.
Biography.com. 2015. “Alan Turing.” Accessed April 1, 2015. http://www.biography.com/people/alan-turing-9512017.
Canty Media. 2015. “The World: Life Expectancy (2015) - Top 100+.” Accessed April 1, 2015. http://www.geoba.se/population.php?pc=world&type=15.
Hyclak, Thomas, Geraint Johnes, and Robert Thornton. Fundamentals of Labor Economics. Boston: Houghton Mifflin Company, 2005.
McMahon, Walter. Education and Development: Measuring the Social Benefits. Oxford: Oxford University Press, 2000.
National Institute of Health. 2015. “Global Competitiveness—The Importance of U.S. Leadership in Science and Innovation for the Future of Our Economy and Our Health.” Accessed April 1, 2015. http://www.nih.gov/about/impact/impact_global.pdf.
National Science Foundation. 2013. “U.S. R&D Spending Resumes Growth in 2010 and 2011 but Still Lags Behind the Pace of Expansion of the National Economy.” Accessed April 1, 2015. http://www.nsf.gov/statistics/infbrief/nsf13313/.
Psacharopoulos, George. “Returns to Investment in Education: A Global Update.” World Development 22, 1994. 1325–1343.
Salientes-Narisma, Corrie. “Samsung Shift to Innovative Devices Pay Off.” Inquirer Technology . Accessed May 15, 2013. http://technology.inquirer.net/23831/samsungs-shift-to-innovative-devices-pays-off.
Notification Switch
Would you like to follow the 'Principles of economics' conversation and receive update notifications?

|
|
|
|
|

|
|

|
|

|
|

|
|

|
|

|
|

|
|

|
|

|
|

|