

| << Chapter < Page | Chapter >> Page > |
The safety net includes a number of other programs: government-subsidized school lunches and breakfasts for children from low-income families; the Special Supplemental Food Program for Women, Infants and Children (WIC) , which provides food assistance for pregnant women and newborns; the Low Income Home Energy Assistance Program, which provides help with home heating bills; housing assistance, which helps pay the rent; and Supplemental Security Income, which provides cash support for the disabled and the elderly poor.
Medicaid was created by Congress in 1965 and is a joint health insurance program entered into by both the states and the federal government. The federal government helps fund Medicaid, but each state is responsible for administering the program, determining the level of benefits, and determining eligibility. It provides medical insurance for certain low-income people, including those below the poverty line, with a focus on families with children, the elderly, and the disabled. About one-third of Medicaid spending is for low-income mothers with children. While an increasing share of the program funding in recent years has gone to pay for nursing home costs for the elderly poor. The program ensures that a basic level of benefits is provided to Medicaid participants, but because each state sets eligibility requirements and provides varying levels of service, the program differs from state to state.
In the past, a common problem has been that many low-paying jobs pay enough to a breadwinner so that a family could lose its eligibility for Medicaid, yet the job does not offer health insurance benefits. A poor parent considering such a job might choose not to work rather than lose health insurance for his or her children. In this way, health insurance can become a part of the poverty trap. Many states recognized this problem in the 1980s and 1990s and expanded their Medicaid coverage to include not just the poor, but the near-poor earning up to 135% or even 185% of the poverty line. Some states also guaranteed that children would not lose coverage if their parents worked.
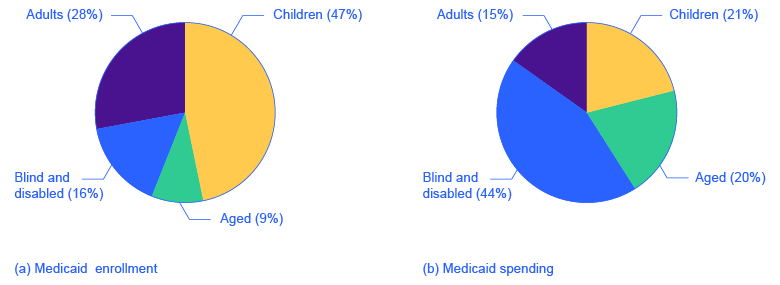
These expanded guarantees cost the government money, of course, but they also helped to encourage those on welfare to enter the labor force. As of 2014, approximately 69.7 million people participated in Medicaid. Of those enrolled, almost half are children. Healthcare expenditures, however, are highest for the elderly population, which comprises approximately 25% of participants. As [link] (a) indicates, the largest number of households that enroll in Medicaid are those with children. Lower-income adults are the next largest group enrolled in Medicaid at 28%. The blind and disabled are 16% of those enrolled, and seniors are 9% of those enrolled. [link] (b) shows how much actual Medicaid dollars are spent for each group. Out of total Medicaid spending, more is spent on seniors (20%) and the blind and disabled (44%). So, 64% of all Medicaid spending goes to seniors, the blind, and disabled. Children receive 21% of all Medicaid spending, followed by adults at 15%.
The group of government programs that assist the poor are called the safety net. In the United States, prominent safety net programs include Temporary Assistance to Needy Families (TANF), the Supplemental Nutrition Assistance Program (SNAP), the earned income tax credit (EITC), Medicaid, and the Special Supplemental Food Program for Women, Infants, and Children (WIC).
Congressional Budget Office. 2015. “The Effects of Potential Cuts in SNAP Spending on Households With Different Amounts of Income.” Accessed April 13, 2015. https://www.cbo.gov/publication/49978.
Falk, Gene. Congressional Research Service. “The Temporary Assistance for Needy Families (TANF) Block Grant: Responses to Frequently Asked Questions.” Last modified October 17, 2013. http://www.fas.org/sgp/crs/misc/RL32760.pdf.
Library of Congress. “Congressional Research Service.” http://www.loc.gov/crsinfo/about/.
Office of Management and Budget. “Fiscal Year 2013 Historical Tables: Budget of the U.S. Government.” http://www.whitehouse.gov/sites/default/files/omb/budget/fy2013/assets/hist.pdf.
Tax Policy Center: Urban Institute and Brookings Institution. “The Tax Policy Briefing Book: Taxation and the Family: What is the Earned Income Tax Credit?” http://www.taxpolicycenter.org/briefing-book/key-elements/family/eitc.cfm.
Notification Switch
Would you like to follow the 'Principles of economics' conversation and receive update notifications?

|
|
|
|
|

|
|

|
|

|
|

|
|

|
|

|
|
|
|
|
|
|
|

|
|

|