<< Chapter < Page Chapter >> Page >

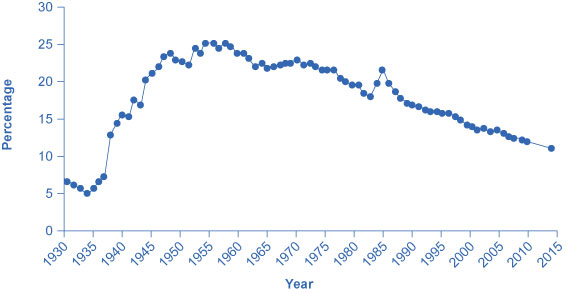
In terms of pay, benefits, and hiring, U.S. unions offer a good news/bad news story. The good news for unions and their members is that their members earn about 20% more than nonunion workers, even after adjusting for factors such as years of work experience and education level. The bad news for unions is that the share of U.S. workers who belong to a labor union has been steadily declining for 50 years, as shown in [link] . About one-quarter of all U.S. workers belonged to a union in the mid-1950s, but only 11.1% of U.S. workers are union members today. If you leave out workers employed by the government (which includes teachers in public schools), only 6.6% of the workers employed by private firms now work for a union.

Percentage of wage and salary workers who are union members

The graph shows that the percentage of wage and salary workers who are union members was lowest in 1935 where it was about 5%. It was highest in in the mid-1950s at around 25%. As of 2010, the percentage was less than 15%.
The share of wage and salary workers who belong to unions rose sharply in the 1930s and 1940s, but has tailed off since then to 11.1% of all workers in 2014.

The following section analyzes the higher pay union workers receive compared the pay rates for nonunion workers. The following section analyzes declining union membership levels. An overview of these two issues will allow us to discuss many aspects of how unions work.

Higher wages for union workers

Why might union workers receive higher pay? What are the limits on how much higher pay they can receive? To analyze these questions, let’s consider a situation where all firms in an industry must negotiate with a single union, and no firm    is allowed to hire nonunion labor. If no labor union existed in this market, then equilibrium (E) in the labor market would occur at the intersection of the demand for labor (D) and the supply of labor (S) in [link] . The union can, however, threaten that, unless firms agree to the wages they demand, the workers will strike. As a result, the labor union manages to achieve, through negotiations with the firms, a union wage of Wu for its members, above what the equilibrium wage would otherwise have been.

Union wage negotiations

The graph shows an upward sloping supply curve and a downward sloping demand curve. The two curves intersect at point E. Vertical dashed lines Qd and Qs intersect above point E with horizontal dashed line Wu. The space between the intersections of these lines creates the excess supply of labor.
Without a union, the equilibrium at E would have involved the wage We and the quantity of labor Qe. However, the union is able to use its bargaining power to raise the wage to Wu. The result is an excess supply of labor for union jobs. That is, a quantity of labor supplied, Qs is greater than firms’ quantity demanded for labor, Qd.

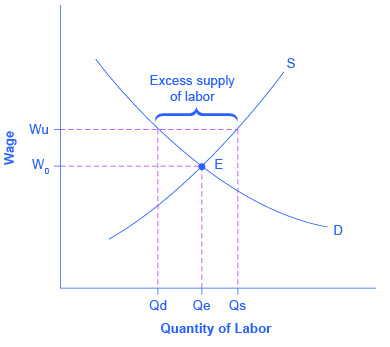
This labor market situation resembles what a monopoly firm does in selling a product, but in this case a union is a monopoly selling labor to firms. At the higher union wage Wu, the firms in this industry will hire less labor than they would have hired in equilibrium. Moreover, an excess supply of workers want union jobs, but firms will not be hiring for such jobs.

From the union point of view, workers who receive higher wages are better off. However, notice that the quantity of workers (Qd) hired at the union wage Wu is smaller than the quantity Qe that would have been hired at the original equilibrium wage. A sensible union must recognize that when it pushes up the wage, it also reduces the incentive of firms to hire. This situation does not necessarily mean that union workers are fired. Instead, it may be that when union workers move on to other jobs or retire, they are not always replaced. Or perhaps when a firm expands production, it expands employment somewhat less with a higher union wage than it would have done with the lower equilibrium wage. Or perhaps a firm decides to purchase inputs from nonunion producers, rather than producing them with its own highly paid unionized workers. Or perhaps the firm moves or opens a new facility in a state or country where unions are less powerful.

Questions & Answers

how do you get the 2/50
Abba Reply
number of sport play by 50 student construct discrete data
Aminu Reply
width of the frangebany leaves on how to write a introduction
Theresa Reply
Solve the mean of variance
Veronica Reply
Step 1: Find the mean. To find the mean, add up all the scores, then divide them by the number of scores. ... Step 2: Find each score's deviation from the mean. ... Step 3: Square each deviation from the mean. ... Step 4: Find the sum of squares. ... Step 5: Divide the sum of squares by n – 1 or N.
kenneth
what is error
Yakuba Reply
Is mistake done to something
Vutshila
Hy
anas
hy
What is the life teble
anas
hy
Jibrin
statistics is the analyzing of data
Tajudeen Reply
what is statics?
Zelalem Reply
how do you calculate mean
Gloria Reply
diveving the sum if all values
Shaynaynay
let A1,A2 and A3 events be independent,show that (A1)^c, (A2)^c and (A3)^c are independent?
Fisaye Reply
what is statistics
Akhisani Reply
data collected all over the world
Shaynaynay
construct a less than and more than table
Imad Reply
The sample of 16 students is taken. The average age in the sample was 22 years with astandard deviation of 6 years. Construct a 95% confidence interval for the age of the population.
Aschalew Reply
Bhartdarshan' is an internet-based travel agency wherein customer can see videos of the cities they plant to visit. The number of hits daily is a normally distributed random variable with a mean of 10,000 and a standard deviation of 2,400 a. what is the probability of getting more than 12,000 hits? b. what is the probability of getting fewer than 9,000 hits?
Akshay Reply
Bhartdarshan'is an internet-based travel agency wherein customer can see videos of the cities they plan to visit. The number of hits daily is a normally distributed random variable with a mean of 10,000 and a standard deviation of 2,400. a. What is the probability of getting more than 12,000 hits
Akshay
1
Bright
Sorry i want to learn more about this question
Bright
Someone help
Bright
a= 0.20233 b=0.3384
Sufiyan
a
Shaynaynay
How do I interpret level of significance?
Mohd Reply
It depends on your business problem or in Machine Learning you could use ROC- AUC cruve to decide the threshold value
Shivam
how skewness and kurtosis are used in statistics
Owen Reply
yes what is it
Taneeya
Got questions? Join the online conversation and get instant answers!
Jobilize.com Reply

Get Jobilize Job Search Mobile App in your pocket Now!

Get it on Google Play Download on the App Store Now


Source:  OpenStax, Principles of economics. OpenStax CNX. Sep 19, 2014 Download for free at http://legacy.cnx.org/content/col11613/1.11
Google Play and the Google Play logo are trademarks of Google Inc.

Notification Switch

Would you like to follow the 'Principles of economics' conversation and receive update notifications?

Ask