

| << Chapter < Page | Chapter >> Page > |
In this example, the marginal revenue and marginal cost curves cross at a price of $4 and a quantity of 80 produced. If the farmer started out producing at a level of 60, and then experimented with increasing production to 70, marginal revenues from the increase in production would exceed marginal costs—and so profits would rise. The farmer has an incentive to keep producing. From a level of 70 to 80, marginal cost and marginal revenue are equal so profit doesn’t change. If the farmer then experimented further with increasing production from 80 to 90, he would find that marginal costs from the increase in production are greater than marginal revenues, and so profits would decline.
The profit-maximizing choice for a perfectly competitive firm will occur where marginal revenue is equal to marginal cost—that is, where MR = MC. A profit-seeking firm should keep expanding production as long as MR>MC. But at the level of output where MR = MC, the firm should recognize that it has achieved the highest possible level of economic profits. (In the example above, the profit maximizing output level is between 70 and 80 units of output, but the firm will not know they’ve maximized profit until they reach 80, where MR = MC.) Expanding production into the zone where MR<MC will only reduce economic profits. Because the marginal revenue received by a perfectly competitive firm is equal to the price P, so that P = MR, the profit-maximizing rule for a perfectly competitive firm can also be written as a recommendation to produce at the quantity where P = MC.
Does maximizing profit (producing where MR = MC) imply an actual economic profit? The answer depends on the relationship between price and average total cost. If the price that a firm charges is higher than its average cost of production for that quantity produced, then the firm will earn profits. Conversely, if the price that a firm charges is lower than its average cost of production, the firm will suffer losses. You might think that, in this situation, the farmer may want to shut down immediately. Remember, however, that the firm has already paid for fixed costs, such as equipment, so it may continue to produce and incur a loss. [link] illustrates three situations: (a) where price intersects marginal cost at a level above the average cost curve, (b) where price intersects marginal cost at a level equal to the average cost curve, and (c) where price intersects marginal cost at a level below the average cost curve.
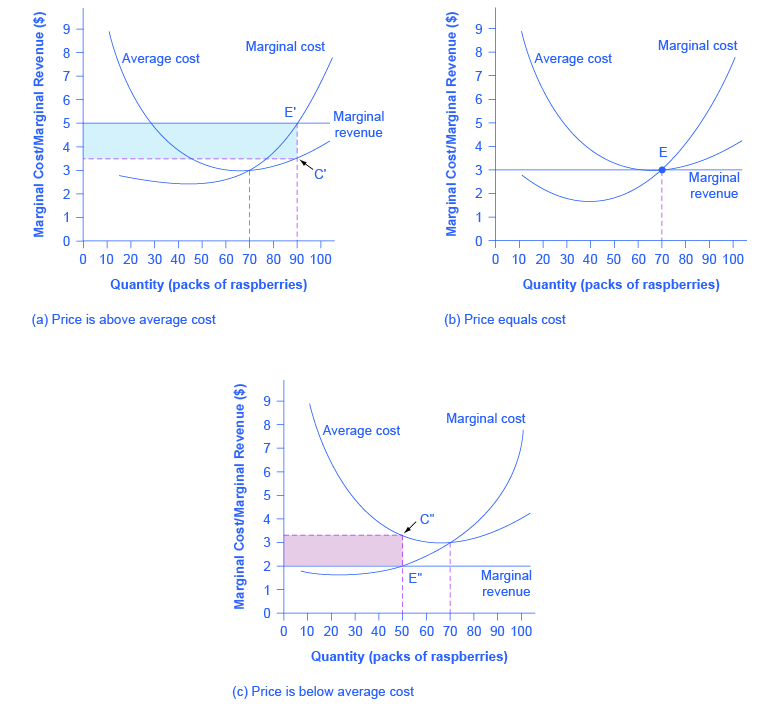
First consider a situation where the price is equal to $5 for a pack of frozen raspberries. The rule for a profit-maximizing perfectly competitive firm is to produce the level of output where Price= MR = MC, so the raspberry farmer will produce a quantity of 90, which is labeled as e in [link] (a). Remember that the area of a rectangle is equal to its base multiplied by its height. The farm’s total revenue at this price will be shown by the large shaded rectangle from the origin over to a quantity of 90 packs (the base) up to point E' (the height), over to the price of $5, and back to the origin. The average cost of producing 80 packs is shown by point C or about $3.50. Total costs will be the quantity of 80 times the average cost of $3.50, which is shown by the area of the rectangle from the origin to a quantity of 90, up to point C, over to the vertical axis and down to the origin. It should be clear from examining the two rectangles that total revenue is greater than total cost. Thus, profits will be the blue shaded rectangle on top.
Notification Switch
Would you like to follow the 'Principles of economics' conversation and receive update notifications?

|
|
|
|
|

|
|

|
|

|
|

|
|

|
|

|
|

|
|

|
|

|
|

|