

| << Chapter < Page | Chapter >> Page > |
( Figure 4 shows the values read from the file named Dsp029.txt and displayed in an improved format.)
In this case, the third frequency in the list is one-half the sampling frequency, which is the folding frequency. The two frequencies on either side ofthat one have values that are symmetrical about the folding frequency.
| Figure 4. A new set of frequency values. |
|---|
Data length: 50
Number sinusoids: 5Frequencies
0.1250.25
0.50.75
0.875Amplitudes
90.090.0
90.090.0
90.0 |
The five horizontal plots in Figure 5 show the result of running the program named Dsp029 with the frequencies shown in Figure 4 .
| Figure 5. Program output for five sinusoids. |
|---|
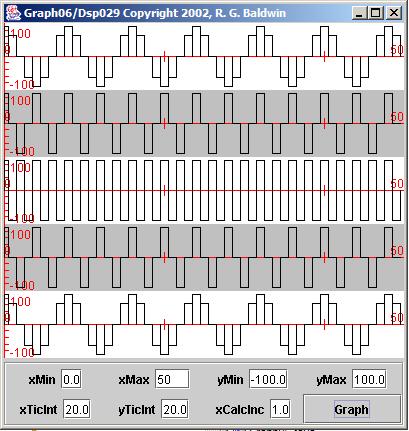 |
The center plot in Figure 5 is the sampled representation of the folding frequency.
The top two plots in Figure 5 are obviously the sampled representations of the two lower frequencies specified by the first two frequencies in Figure 4 .
However, it is not so obvious that the bottom two plots in Figure 5 are the sampled representations of the two higher frequencies specified by the last twofrequencies in Figure 4 . They look exactly like the top two plots but in reverse order.
Frequencies above one-half the sampling frequency are not distinguishable by viewing the sampled data. In fact, they are converted to lower frequencies bysampling process. The new lower frequencies fold around a point in the frequency spectrum given by one-half the sampling frequency. That is why it is called thefolding frequency. (In 1933, this frequency was named after scientist Harry Nyquist .)
Let's look at one more example of plotted sinusoids. Consider the frequency values shown in Figure 6 . The second and third frequencies are symmetrical about the sampling frequency. The fourth and fifth frequencies are symmetrical abouttwice the sampling frequency. The first frequency value is the same distance from zero as the other four frequencies are from the sampling frequency andtwice the sampling frequency.
| Figure 6. One more example. |
|---|
Data length: 50
Number sinusoids: 5Frequencies
0.10.9
1.11.9
2.1Amplitudes
90.090.0
90.090.0
90.0 |
Figure 7 shows the output produced by running the program named Dsp029 with the frequency parameters specified by Figure 6 .
| Figure 7. Program output for five sinusoids. |
|---|
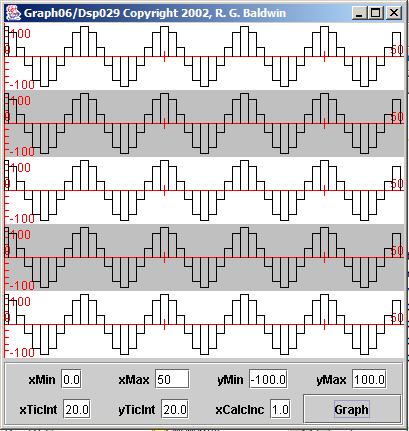 |
Although the actual frequencies of the five cosine functions are significantly different, once they are sampled, they are indistinguishable. Thesampling process converts the actual frequencies to new frequencies that not only fold around one-half the sampling frequency, they also fold around allmultiples of one-half the sampling frequency.
The program named Dsp029 is provided in Listing 16 near the end of the module. I will break the program down and explain it in fragments,beginning with the fragment shown in Listing 1 .
| Listing 1. Beginning of the class named Dsp029. |
|---|
class Dsp029 implements GraphIntfc01{
  final double pi = Math.PI;//for simplification//Begin default parameters
  int len = 400;//data lengthint numberSinusoids = 5;
  //Frequencies of the sinusoidsdouble[] freq = {0.1,0.25,0.5,0.75,0.9};//Amplitudes of the sinusoids
  double[]amp = {75,75,75,75,75};
//End default parameters |
Notification Switch
Would you like to follow the 'Digital signal processing - dsp' conversation and receive update notifications?

|
|

|
|

|
|

|
|

|
|

|
|

|
|

|
|

|
|

|