<< Chapter < Page
  Digital signal processing - dsp     Page 3 / 24
Chapter >> Page >
Figure 1. Required parameters.
Data length as type int Number of sinusoids as type int. Max value is 5.List of sinusoid frequency values as type double. List of sinusoid amplitude values as type double.

The length of the two lists

The number of values in each of the lists must match the value for the number of sinusoids. Also, you must not allow blank lines at the end of the data in thefile.

Frequency value specifications

Each frequency value is specified as a type double value representing a fractional part of the sampling frequency.

(For example, a double value of 0.5 specifies one-half the sampling frequency, or the Nyquist folding frequency. A double value of 2.0 specifiesa frequency that is twice the sampling frequency.)

Figure 2 shows the contents of the file named Dsp029.txt that I used to produce the output shown in Figure 3 . I will discuss that output later.

Figure 2. Actual parameter values.
50.0 50.03125 0.06250.125 0.250.5 9090 9090 90

The plotting program named Graph06

The plotting program that is used to plot the output data from this program requires that the program implement GraphIntfc01 . I discussed that interface in the module titled Plotting Engineering and Scientific Data using Java . For example, the plotting program named Graph06 can be used to plot the data produced by this program. When it is used, the program is executed and its output is plotted byentering the following at the command line prompt:

java Graph06 Dsp029

Program output

Figure 3 shows the output produced by running the program named Dsp029 with the parameters shown in Figure 2 and then adjusting the xMax parameter in thetextbox at the bottom of the display.

Figure 3. Program output for five sinusoids.
missing image

Five horizontal plots

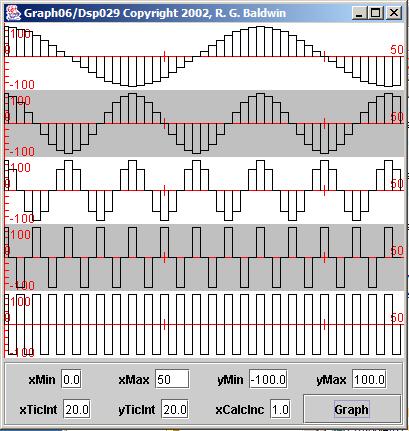
Each of the five horizontal plots in Figure 3 shows a sampled sinusoid. Each of the vertical bars represents one sample value for a given sinusoid.

If you examine the frequency values in Figure 2 carefully, you will see that they represent the sampling frequency divided by the factors 32, 16, 8, 4, and2. Thus, the last frequency value is the Nyquist folding frequency and the first four frequency values are related to that frequency by multiples of two.

The horizontal plot at the top of Figure 3 is a reasonably well defined cosine wave. The horizontal plot at the bottom of Figure 3 shows the result of having exactly two samples per cycle of the sinusoid. Using this plottingscheme, the sampled sinusoid is represented as a square wave. Using another plotting scheme (such as that used in the program named Graph03 ) the sampled sinusoid at the bottom would be represented as a triangular wave.

An upper frequency limit

Regardless of the plotting scheme used, it should be obvious that a set of uniform samples cannot possibly represent frequencies higher than one-half thesampling frequency because then there would be less than one sample per cycle of the sinusoid.

The Nyquist folding frequency

Now I will show you why the frequency at one-half the sampling frequency is referred to as the folding frequency using the new set of frequency values shownin Figure 4 .

Questions & Answers

What are the factors that affect demand for a commodity
Florence Reply
differentiate between demand and supply giving examples
Lambiv Reply
differentiated between demand and supply using examples
Lambiv
what is labour ?
Lambiv
how will I do?
Venny Reply
how is the graph works?I don't fully understand
Rezat Reply
information
Eliyee
devaluation
Eliyee
t
WARKISA
hi guys good evening to all
Lambiv
multiple choice question
Aster Reply
appreciation
Eliyee
explain perfect market
Lindiwe Reply
In economics, a perfect market refers to a theoretical construct where all participants have perfect information, goods are homogenous, there are no barriers to entry or exit, and prices are determined solely by supply and demand. It's an idealized model used for analysis,
Ezea
What is ceteris paribus?
Shukri Reply
other things being equal
AI-Robot
When MP₁ becomes negative, TP start to decline. Extuples Suppose that the short-run production function of certain cut-flower firm is given by: Q=4KL-0.6K2 - 0.112 • Where is quantity of cut flower produced, I is labour input and K is fixed capital input (K-5). Determine the average product of lab
Kelo
Extuples Suppose that the short-run production function of certain cut-flower firm is given by: Q=4KL-0.6K2 - 0.112 • Where is quantity of cut flower produced, I is labour input and K is fixed capital input (K-5). Determine the average product of labour (APL) and marginal product of labour (MPL)
Kelo
yes,thank you
Shukri
Can I ask you other question?
Shukri
what is monopoly mean?
Habtamu Reply
What is different between quantity demand and demand?
Shukri Reply
Quantity demanded refers to the specific amount of a good or service that consumers are willing and able to purchase at a give price and within a specific time period. Demand, on the other hand, is a broader concept that encompasses the entire relationship between price and quantity demanded
Ezea
ok
Shukri
how do you save a country economic situation when it's falling apart
Lilia Reply
what is the difference between economic growth and development
Fiker Reply
Economic growth as an increase in the production and consumption of goods and services within an economy.but Economic development as a broader concept that encompasses not only economic growth but also social & human well being.
Shukri
production function means
Jabir
What do you think is more important to focus on when considering inequality ?
Abdisa Reply
any question about economics?
Awais Reply
sir...I just want to ask one question... Define the term contract curve? if you are free please help me to find this answer 🙏
Asui
it is a curve that we get after connecting the pareto optimal combinations of two consumers after their mutually beneficial trade offs
Awais
thank you so much 👍 sir
Asui
In economics, the contract curve refers to the set of points in an Edgeworth box diagram where both parties involved in a trade cannot be made better off without making one of them worse off. It represents the Pareto efficient allocations of goods between two individuals or entities, where neither p
Cornelius
In economics, the contract curve refers to the set of points in an Edgeworth box diagram where both parties involved in a trade cannot be made better off without making one of them worse off. It represents the Pareto efficient allocations of goods between two individuals or entities,
Cornelius
Suppose a consumer consuming two commodities X and Y has The following utility function u=X0.4 Y0.6. If the price of the X and Y are 2 and 3 respectively and income Constraint is birr 50. A,Calculate quantities of x and y which maximize utility. B,Calculate value of Lagrange multiplier. C,Calculate quantities of X and Y consumed with a given price. D,alculate optimum level of output .
Feyisa Reply
Answer
Feyisa
c
Jabir
the market for lemon has 10 potential consumers, each having an individual demand curve p=101-10Qi, where p is price in dollar's per cup and Qi is the number of cups demanded per week by the i th consumer.Find the market demand curve using algebra. Draw an individual demand curve and the market dema
Gsbwnw Reply
suppose the production function is given by ( L, K)=L¼K¾.assuming capital is fixed find APL and MPL. consider the following short run production function:Q=6L²-0.4L³ a) find the value of L that maximizes output b)find the value of L that maximizes marginal product
Abdureman
Got questions? Join the online conversation and get instant answers!
Jobilize.com Reply

Get Jobilize Job Search Mobile App in your pocket Now!

Get it on Google Play Download on the App Store Now


Source:  OpenStax, Digital signal processing - dsp. OpenStax CNX. Jan 06, 2016 Download for free at https://legacy.cnx.org/content/col11642/1.38
Google Play and the Google Play logo are trademarks of Google Inc.

Notification Switch

Would you like to follow the 'Digital signal processing - dsp' conversation and receive update notifications?

Ask