<< Chapter < Page
  Digital signal processing - dsp     Page 3 / 14
Chapter >> Page >

This program can be run with either Graph03 or Graph06 in order to plot the results. Enter the following at the command-line prompt to run the program with Graph03 after everything is compiled:

java Graph03 Dsp035

The program was tested using JDK 1.8 under Windows 7.

The order of the plotted results

When the data is plotted (see Figure 1 ) using the programs Graph03 or Graph06 , the plots appear in the following order from top to bottom:

  • The input time series
  • The real spectrum of the input time series
  • The imaginary spectrum of the input time series
  • The amplitude spectrum of the input time series
  • The output time series produced by the inverse Fourier transform

The format of the plots

There were 256 values plotted horizontally in each section. I plotted the values on a grid that is 270 units wide to make it easier to view the plots onthe rightmost end. This leaves some blank space on the rightmost end to contain the numbers, preventing the numbers from being mixed in with the plotted values.The last actual data value coincides with the rightmost tick mark on each plot.

The forward Fourier transform

A static method named transform belonging to the class named ForwardRealToComplex01 was used to perform the forward Fourier transform.

(I explained this class and the transform method in the earlier module titled Spectrum Analysis using Java, Sampling Frequency, Folding Frequency, and the FFT Algorithm .)

The method named transform does not implement an FFT algorithm. Rather, it implements a DFT algorithm, which is more general than, but much slower than anFFT algorithm.

(See the program named Dsp036 later in the module for the use of an FFT algorithm.)

The inverse Fourier transform

A static method named inverseTransform belonging to the class named InverseComplexToReal01 was used to perform the inverse Fourier transform. I will explain this method later in this module.

Results

Before getting into the technical details of the program, let's take a look at the results shown in Figure 1 .

The top plot in Figure 1 shows the input time series used in this experiment.

Figure 1. Forward and inverse transform of a time series using DFT algorithm.
missing image

Length is a power of two

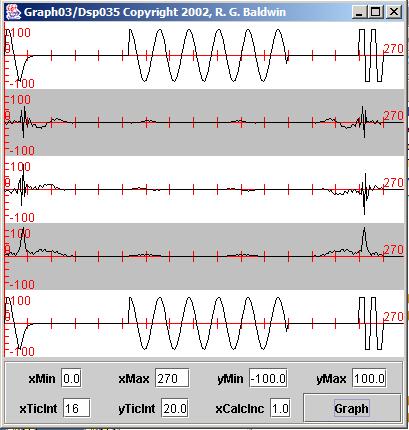
The time series is 256 samples long. Although the DFT algorithm can accommodate time series of arbitrary lengths, I set the length of this timeseries to a power of two so that I can compare the results with results produced by an FFT algorithm later in the module.

(Recall that most FFT algorithms are restricted to input data lengths that are a power of two.)

The input time series

As you can see, the input time series consists of three concatenated pulses separated by blank spaces. The pulse on the leftmost end consists simply of somevalues that I entered into the time series to create a pulse with an interesting shape.

The middle pulse is a truncated sinusoid.

The rightmost pulse is a truncated square wave.

The objective

The objective of the experiment is to confirm that it is possible to transform this time series into the frequency domain using a forward Fouriertransform, and then to recreate the time series by using an inverse Fourier transform to transform the complex spectrum back into the time domain.

Questions & Answers

Ayele, K., 2003. Introductory Economics, 3rd ed., Addis Ababa.
Widad Reply
can you send the book attached ?
Ariel
?
Ariel
What is economics
Widad Reply
the study of how humans make choices under conditions of scarcity
AI-Robot
U(x,y) = (x×y)1/2 find mu of x for y
Desalegn Reply
U(x,y) = (x×y)1/2 find mu of x for y
Desalegn
what is ecnomics
Jan Reply
this is the study of how the society manages it's scarce resources
Belonwu
what is macroeconomic
John Reply
macroeconomic is the branch of economics which studies actions, scale, activities and behaviour of the aggregate economy as a whole.
husaini
etc
husaini
difference between firm and industry
husaini Reply
what's the difference between a firm and an industry
Abdul
firm is the unit which transform inputs to output where as industry contain combination of firms with similar production 😅😅
Abdulraufu
Suppose the demand function that a firm faces shifted from Qd  120 3P to Qd  90  3P and the supply function has shifted from QS  20  2P to QS 10  2P . a) Find the effect of this change on price and quantity. b) Which of the changes in demand and supply is higher?
Toofiq Reply
explain standard reason why economic is a science
innocent Reply
factors influencing supply
Petrus Reply
what is economic.
Milan Reply
scares means__________________ends resources. unlimited
Jan
economics is a science that studies human behaviour as a relationship b/w ends and scares means which have alternative uses
Jan
calculate the profit maximizing for demand and supply
Zarshad Reply
Why qualify 28 supplies
Milan
what are explicit costs
Nomsa Reply
out-of-pocket costs for a firm, for example, payments for wages and salaries, rent, or materials
AI-Robot
concepts of supply in microeconomics
David Reply
economic overview notes
Amahle Reply
identify a demand and a supply curve
Salome Reply
i don't know
Parul
there's a difference
Aryan
Demand curve shows that how supply and others conditions affect on demand of a particular thing and what percent demand increase whith increase of supply of goods
Israr
Hi Sir please how do u calculate Cross elastic demand and income elastic demand?
Abari
Got questions? Join the online conversation and get instant answers!
Jobilize.com Reply

Get Jobilize Job Search Mobile App in your pocket Now!

Get it on Google Play Download on the App Store Now


Source:  OpenStax, Digital signal processing - dsp. OpenStax CNX. Jan 06, 2016 Download for free at https://legacy.cnx.org/content/col11642/1.38
Google Play and the Google Play logo are trademarks of Google Inc.

Notification Switch

Would you like to follow the 'Digital signal processing - dsp' conversation and receive update notifications?

Ask