

| << Chapter < Page | Chapter >> Page > |
The output produced by performing spectral analysis on these five sinusoids is shown in Figure 9 . The computation and display of this spectral analysis was performed using the programs named Dsp028 and Graph03 . (Note that the parameters in the text boxes at the bottom were used to alter the appearance of the plots.)
| Figure 9. Spectral analysis of five sinusoids. |
|---|
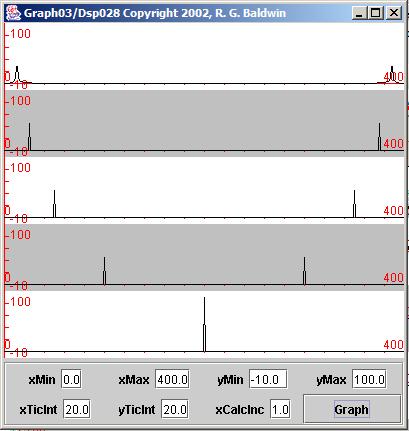 |
Five separate spectral analyses were performed and the results of those five spectral analyses are shown in Figure 9 . Each of the horizontal lines in Figure 9 is the horizontal axis used to display the result of performing a spectral analysis on a different sinusoid. In other words, Figure 9 contains five separate graphs moving from the top to the bottom of the display. The individualgraphs have alternating white and gray backgrounds to make them easier to separate visually.
The top graph in Figure 9 shows the result of performing a spectral analysis on the top sinusoid in Figure 3 . Moving down the page, each graph in Figure 9 shows the result of performing a spectral analysis on the corresponding sinusoidin Figure 3 .
The horizontal axes in Figure 9 represent the frequency range from zero to the sampling frequency.
(The frequency range covered is specified by the Lower frequency bound and the Upper frequency bound parameters in Figure 8 .)
The horizontal units in Figure 9 don't represent frequency in an absolute sense of cycles per second or Hertz. Rather, the horizontal units in Figure 9 represent the frequency bins for which spectral energy was computed. In thiscase, the spectral energy for each sinusoid was computed in 400 equally spaced bins distributed between zero and the sampling frequency.
(The number of frequency bins for each individual spectrum computed by this program is equal to the Data length parameter in Figure 8 . Those frequency bins are distributed uniformly between the Lower frequency bound and the Upper frequency bound parameters in Figure 8 .)
Because the right-most end of each horizontal axis in Figure 9 represents the sampling frequency, the center of each horizontal axis represents one-half thesampling frequency, or the Nyquist folding frequency. Thus, the frequency represented by the center of each horizontal axis represents the frequencyspecified by a value of 0.5 in Figure 8 .
You can see a large peak in energy at the folding frequency of the bottom graph in Figure 9 . That peak corresponds to the frequency of the fifth sinusoid specified in the parameters shown in Figure 8 . (This also corresponds to the spectrum of the bottom graph in Figure 3 .)
Knowing that, you should be able to correlate each of the peaks to the left of center in Figure 9 with the frequencies of the sinusoids specified in Figure 8 and with the individual sinusoids plotted in Figure 3 .
Figure 9 clearly shows the frequency folding effect of the sampling process illustrated earlier. As you can see, the peaks in the various graphs to theright of the folding frequency are mirror images of the peaks to the left of the folding frequency. In other words, given a set of samples of a sinusoid, thespectral analysis process is unable to determine whether the peak is above or below the folding frequency, so the energy is equally distributed between twopeaks on opposite sides of the folding frequency.
Notification Switch
Would you like to follow the 'Digital signal processing - dsp' conversation and receive update notifications?

|
|

|
|

|
|

|
|

|
|
|
|
|

|
|

|
|

|
|

|