

| << Chapter < Page | Chapter >> Page > |
Each year, the government borrows funds from U.S. citizens and foreigners to cover its budget deficits. It does this by selling securities (Treasury bonds, notes, and bills)—in essence borrowing from the public and promising to repay with interest in the future. From 1961 to 1997, the U.S. government has run budget deficits, and thus borrowed funds, in almost every year. It had budget surpluses from 1998 to 2001, and then returned to deficits.
The interest payments on past federal government borrowing were typically 1–2% of GDP in the 1960s and 1970s but then climbed above 3% of GDP in the 1980s and stayed there until the late 1990s. The government was able to repay some of its past borrowing by running surpluses from 1998 to 2001 and, with help from low interest rates, the interest payments on past federal government borrowing had fallen back to 1.4% of GDP by 2012.
We investigate the patterns of government borrowing and debt in more detail later in this chapter, but first we need to clarify the difference between the deficit and the debt. The deficit is not the debt . The difference between the deficit and the debt lies in the time frame. The government deficit (or surplus) refers to what happens with the federal government budget each year. The government debt is accumulated over time; it is the sum of all past deficits and surpluses. If you borrow $10,000 per year for each of the four years of college, you might say that your annual deficit was $10,000, but your accumulated debt over the four years is $40,000.
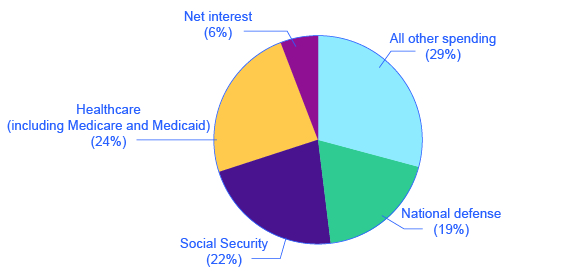
These four categories—national defense, Social Security, healthcare, and interest payments—account for roughly 73% of all federal spending, as [link] shows. The remaining 27% wedge of the pie chart covers all other categories of federal government spending: international affairs; science and technology; natural resources and the environment; transportation; housing; education; income support for the poor; community and regional development; law enforcement and the judicial system; and the administrative costs of running the government.
Although federal government spending often gets most of the media attention, state and local government spending is also substantial—at about $3.1 trillion in 2014. [link] shows that state and local government spending has increased during the last four decades from around 8% to around 14% today. The single biggest item is education, which accounts for about one-third of the total. The rest covers programs like highways, libraries, hospitals and healthcare, parks, and police and fire protection. Unlike the federal government, all states (except Vermont) have balanced budget laws, which means any gaps between revenues and spending must be closed by higher taxes, lower spending, drawing down their previous savings, or some combination of all of these.
Notification Switch
Would you like to follow the 'Principles of macroeconomics for ap® courses' conversation and receive update notifications?

|
|
|
|
|

|
|

|
|

|
|

|
|

|
|

|
|

|
|

|
|

|
|

|