

| << Chapter < Page | Chapter >> Page > |
The five pulses used in this experiment are shown in Figure 6 .
| Figure 6. Five pulses with additive sinusoids. |
|---|
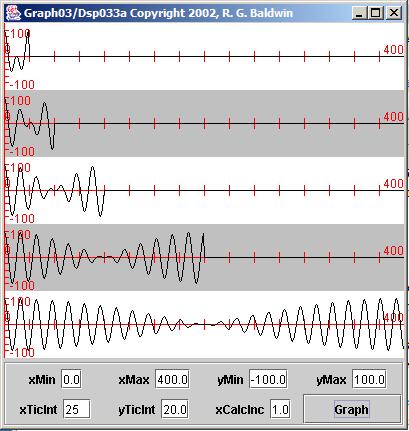 |
Unlike in the previous two cases shown in Figure 1 and Figure 4 , each of these pulses has a different shape from the others. In other words, in theprevious two cases, each pulse simply looked like a longer or shorter version of the other pulses. That is not the case in this example.
(Note however that the third pulse in Figure 6 looks just like the third pulse in Figure 4 . They were created using the same parameters. However, none of the other pulses in Figure 6 look like the corresponding pulses in Figure 4 , and none of the pulses in Figure 6 look like the pulses in Figure 1 .)
Figure 7 shows the result of performing spectral analysis on the five time series containing the pulses shown in Figure 6 .
| Figure 7. Spectral analyses of five pulses. |
|---|
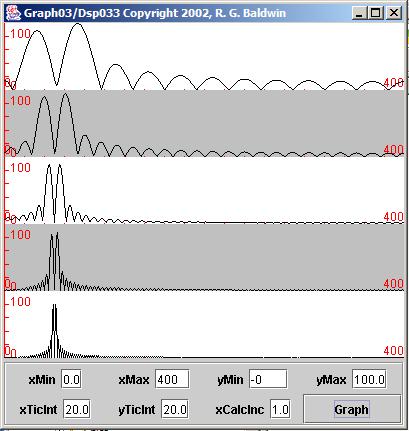 |
When we examine the code, you will see that the frequency separation for the first two pulses has been increased to the reciprocal of the pulse length ineach case. This results in the two peaks in the spectrum for each of the first two pulses being resolvable in Figure 7 .
The spectrum for the third pulse shown in Figure 7 is almost identical to the spectrum for the third pulse shown in Figure 5 . The only difference is that I had to decrease the vertical scaling on all of the plots in Figure 5 to keep the peak in the top plot within the bounds of the plot.
When we examine the code, you will also see that the frequency separation for the last two pulses has been decreased to the reciprocal of the pulse length ineach case. This results in the two peaks in the spectrum for each of the last two pulses being closer than before in Figure 7 .
The peaks in the bottom two plots in Figure 7 appear to be resolvable, but we can't be absolutely certain because they are so close together, particularly forthe last plot.
(If you expand the Frame to full screen when you run this program, you will see that the two peaks are resolvable, but I can't do that and staywithin this narrow publication format.)
Figure 8 adjusts the plotting parameters to cause the left-most one-fourth of the data in Figure 7 to be plotted in the full width of the Frame in Figure 8 .
| Figure 8. Expanded spectral analyses of five pulses. |
|---|
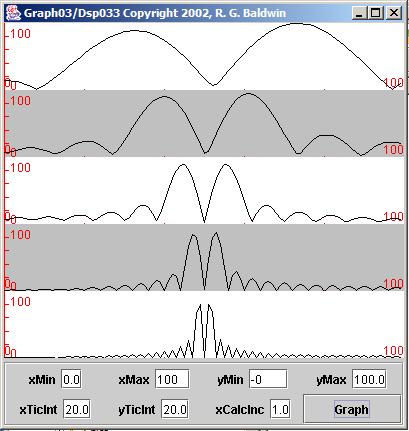 |
Figure 8 shows that the two peaks are barely resolvable for all five of the pulses shown in Figure 6 .
(There is no space between the peaks at the baseline in Figure 8 , but the plots do go almost down to the baseline half way between the two peaks.)
The plots in Figure 7 and Figure 8 were produced by running the program named Dsp033 and plotting the results with the program named Graph03 .
A complete listing of the program named Dsp033 is shown in Listing 14 near the end of the module.
This program is the same as Dsp032 except that the separation between the frequencies of the two sinusoids is the reciprocal of the length of the pulse ineach case.
Notification Switch
Would you like to follow the 'Digital signal processing - dsp' conversation and receive update notifications?

|
|

|
|

|
|

|
|

|
|

|
|

|
|

|
|
|
|
|

|