<< Chapter < Page Chapter >> Page >

Screen output

The text shown in Figure 13 should appear in your browser when you open the html file in your browser.

Figure 13 . Screen output for Listing #3.
Hello from JavaScript vecResultMag = 8.11vecResultAng = 90.49 The End

As you can see, the displacement vector is just a little over eight meters at an angle of about 90.5 degrees. In other words, your ending position wasapproximately 8 meters north of your starting position. Hopefully you were able to arrive at a very similar answer using your graph board.

Explanation of the code

The code in Listing 3 is very similar to the code in Listing 2 . However, there is more of it because the code is adding four vectors instead of only 2.

As before, Listing 2 begins with the getAngle method that we developed earlier.

Magnitude and angle for each vector

Then Listing 2 defines eight variables containing the magnitudes and angles of the four segments of the walk.

(Note that the names that I used for the variables in this script are somewhat simpler than the names that I used in Listing 2.)

Horizontal and vertical components

Following that, Listing 2 computes the horizontal and vertical components for each of the four vectors and saves those values in eight different variables.

Sums of components

Then Listing 2 computes and saves the sum of all four horizontal components and computes and saves the sum of all four verticalcomponents.

After that, there is essentially no difference between the script in Listing 3 and the script in Listing 2 .

Other vector operations

In addition to the addition and subtraction of vectors, there are other operations that can be performed using vectors, such as the dot product andthe cross product. However, those operations are beyond the scope of this module.

Non-mirror-image graphics

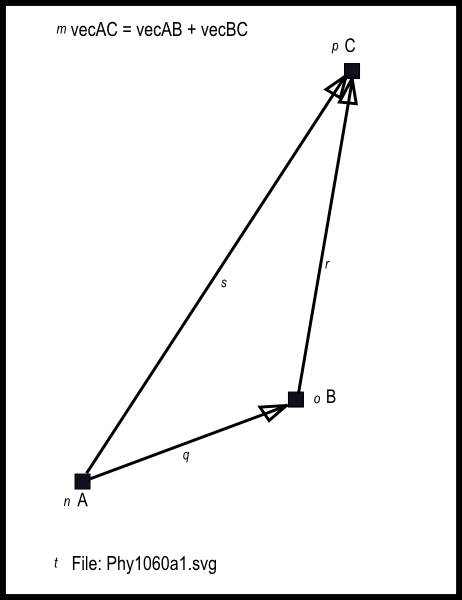
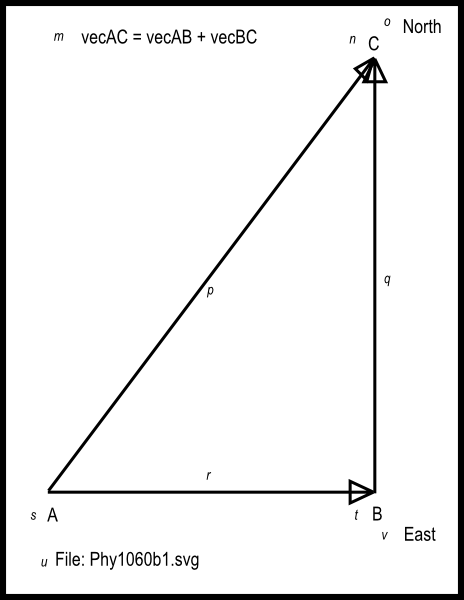
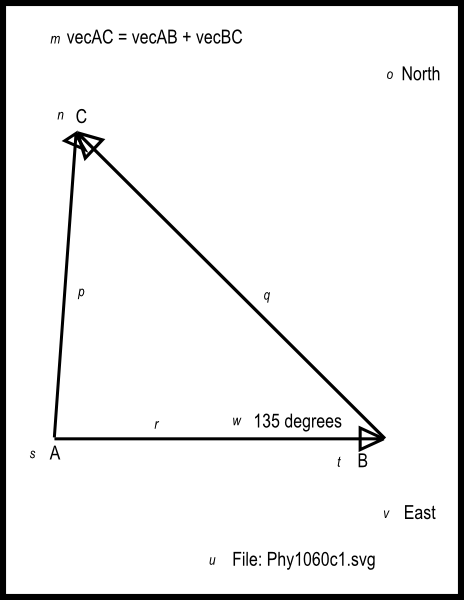
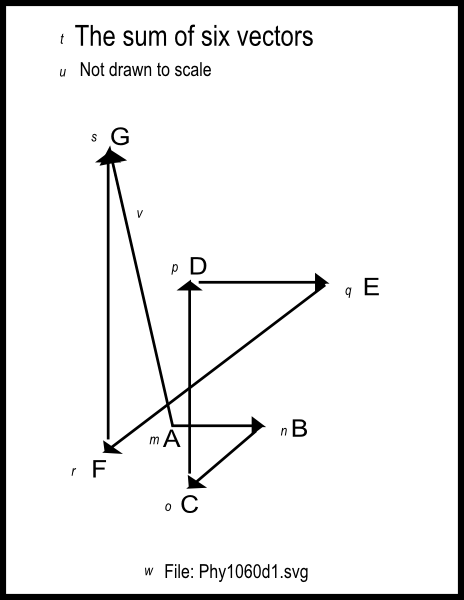
Figure 14 through Figure 18 below are non-mirror-image versions of Figure 2 , Figure 4 , Figure 6 , Figure 8 , and Figure 10 .

Figure 14 . Non-mirror-image version of the image contained in the file named Phy1060a1.svg.
Missing image
Figure 15 . Non-mirror-image version of the image contained in the file named Phy1060b1.svg.
Missing image
Figure 16 . Non-mirror-image version of the image contained in the file named Phy1060c1.svg.
Missing image
Figure 17 . Non-mirror-image version of the image contained in the file named Phy1060d1.svg.
Missing image
Figure 18 . Non-mirror-image version of the mage contained in the file named Phy1060e1.svg.
Missing image

Run the scripts

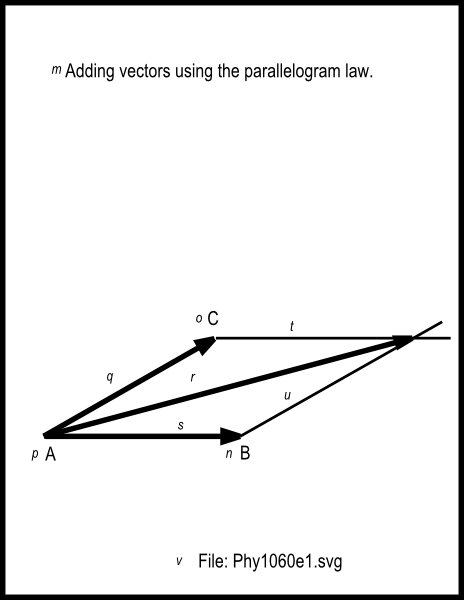
I encourage you to run the scripts that I have presented in this lesson to confirm that you get the same results. Copy the code for each script intoa text file with an extension of html. Then open that file in your browser. Experiment withthe code, making changes, and observing the results of your changes. Make certain that you can explain why your changes behave as they do.

Resources

I will publish a module containing consolidated links to resources on my Connexions web page and will update and add to the list as additional modulesin this collection are published.

Miscellaneous

This section contains a variety of miscellaneous information.

Housekeeping material
  • Module name: Motion -- Displacement and Vectors for Blind Students
  • File: Phy1060.htm
  • Revised: 10/01/15
  • Keywords:
    • physics
    • accessible
    • blind
    • graph board
    • protractor
    • screen reader
    • refreshable Braille display
    • JavaScript
    • trigonometry
    • motion
    • rest
    • body
    • displacement
    • velocity
    • acceleration
    • kinematics
    • kinetics
    • resultant
    • subtrahend
    • minuend
Disclaimers:

Financial : Although the openstax CNX site makes it possible for you to download a PDF file for the collection that contains thismodule at no charge, and also makes it possible for you to purchase a pre-printed version of the PDF file, you should beaware that some of the HTML elements in this module may not translate well into PDF.

You also need to know that Prof. Baldwin receives no financial compensation from openstax CNX even if you purchase the PDF version of the collection.

In the past, unknown individuals have copied Prof. Baldwin's modules from cnx.org, converted them to Kindle books, and placed them for sale on Amazon.com showing Prof. Baldwin as the author.Prof. Baldwin neither receives compensation for those sales nor does he know who doesreceive compensation. If you purchase such a book, please be aware that it is a copy of a collection that is freelyavailable on openstax CNX and that it was made and published without the prior knowledge of Prof. Baldwin.

Affiliation : Prof. Baldwin is a professor of Computer Information Technology at Austin Community College in Austin, TX.

-end-

Questions & Answers

differentiate between demand and supply giving examples
Lambiv Reply
differentiated between demand and supply using examples
Lambiv
what is labour ?
Lambiv
how will I do?
Venny Reply
how is the graph works?I don't fully understand
Rezat Reply
information
Eliyee
devaluation
Eliyee
t
WARKISA
hi guys good evening to all
Lambiv
multiple choice question
Aster Reply
appreciation
Eliyee
explain perfect market
Lindiwe Reply
In economics, a perfect market refers to a theoretical construct where all participants have perfect information, goods are homogenous, there are no barriers to entry or exit, and prices are determined solely by supply and demand. It's an idealized model used for analysis,
Ezea
What is ceteris paribus?
Shukri Reply
other things being equal
AI-Robot
When MP₁ becomes negative, TP start to decline. Extuples Suppose that the short-run production function of certain cut-flower firm is given by: Q=4KL-0.6K2 - 0.112 • Where is quantity of cut flower produced, I is labour input and K is fixed capital input (K-5). Determine the average product of lab
Kelo
Extuples Suppose that the short-run production function of certain cut-flower firm is given by: Q=4KL-0.6K2 - 0.112 • Where is quantity of cut flower produced, I is labour input and K is fixed capital input (K-5). Determine the average product of labour (APL) and marginal product of labour (MPL)
Kelo
yes,thank you
Shukri
Can I ask you other question?
Shukri
what is monopoly mean?
Habtamu Reply
What is different between quantity demand and demand?
Shukri Reply
Quantity demanded refers to the specific amount of a good or service that consumers are willing and able to purchase at a give price and within a specific time period. Demand, on the other hand, is a broader concept that encompasses the entire relationship between price and quantity demanded
Ezea
ok
Shukri
how do you save a country economic situation when it's falling apart
Lilia Reply
what is the difference between economic growth and development
Fiker Reply
Economic growth as an increase in the production and consumption of goods and services within an economy.but Economic development as a broader concept that encompasses not only economic growth but also social & human well being.
Shukri
production function means
Jabir
What do you think is more important to focus on when considering inequality ?
Abdisa Reply
any question about economics?
Awais Reply
sir...I just want to ask one question... Define the term contract curve? if you are free please help me to find this answer 🙏
Asui
it is a curve that we get after connecting the pareto optimal combinations of two consumers after their mutually beneficial trade offs
Awais
thank you so much 👍 sir
Asui
In economics, the contract curve refers to the set of points in an Edgeworth box diagram where both parties involved in a trade cannot be made better off without making one of them worse off. It represents the Pareto efficient allocations of goods between two individuals or entities, where neither p
Cornelius
In economics, the contract curve refers to the set of points in an Edgeworth box diagram where both parties involved in a trade cannot be made better off without making one of them worse off. It represents the Pareto efficient allocations of goods between two individuals or entities,
Cornelius
Suppose a consumer consuming two commodities X and Y has The following utility function u=X0.4 Y0.6. If the price of the X and Y are 2 and 3 respectively and income Constraint is birr 50. A,Calculate quantities of x and y which maximize utility. B,Calculate value of Lagrange multiplier. C,Calculate quantities of X and Y consumed with a given price. D,alculate optimum level of output .
Feyisa Reply
Answer
Feyisa
c
Jabir
the market for lemon has 10 potential consumers, each having an individual demand curve p=101-10Qi, where p is price in dollar's per cup and Qi is the number of cups demanded per week by the i th consumer.Find the market demand curve using algebra. Draw an individual demand curve and the market dema
Gsbwnw Reply
suppose the production function is given by ( L, K)=L¼K¾.assuming capital is fixed find APL and MPL. consider the following short run production function:Q=6L²-0.4L³ a) find the value of L that maximizes output b)find the value of L that maximizes marginal product
Abdureman
types of unemployment
Yomi Reply
What is the difference between perfect competition and monopolistic competition?
Mohammed
Got questions? Join the online conversation and get instant answers!
Jobilize.com Reply

Get Jobilize Job Search Mobile App in your pocket Now!

Get it on Google Play Download on the App Store Now


Source:  OpenStax, Accessible physics concepts for blind students. OpenStax CNX. Oct 02, 2015 Download for free at https://legacy.cnx.org/content/col11294/1.36
Google Play and the Google Play logo are trademarks of Google Inc.

Notification Switch

Would you like to follow the 'Accessible physics concepts for blind students' conversation and receive update notifications?

Ask