

| << Chapter < Page | Chapter >> Page > |
Thus, changing the separation between the elements has a significant impact on the wavenumber response of the array.
Finally, consider the pair of images on the right where the elements are even further apart. This array response has even more peaks and valleys than theother two.
The sum of the outputs from an array of sensor elements represents a form of wavenumber filter (much as the correct combination of resistors, capacitors, and inductors represents a frequency filter) . If we need to pass signals having one wavenumber and to suppress signals having a different wavenumber, we may be ableto adjust the separation between the elements so as to put a peak on the desirable wavenumber and to put a null point on the undesirable wavenumbers.
Of course, with only two elements, we don't have very many degrees of freedom to work with. We could exercise more control over our wavenumber filter if wehad more elements. We could do even better if we had the ability to give each element a different weight (including a negative weight) when the signals from all the elements are added together. Finally, we could do even better still ifwe had the ability to insert a programmable time delay (phase shift) into the output from each of the elements before adding them together.
(The use of programmable time delays falls in the category of a space series that is complex rather than being purely real. Thus, that topic isbeyond the scope of this module.)
Now let's modify our scenario and see what we can learn in the process. We are going to increase the size of the array from two to three elements. We arealso going to assume that we can apply amplification, sign reversal, or both to the element output signals before adding those signals together. The results areshown in Figure 3 . We will compare the results in Figure 3 with the results discussed earlier in Figure 2 , so this may be a good time for you to open another copy of this module in a separate browser window if you haven't alreadydone so.
| Figure 3. A three-element array with weighted sensors. |
|---|
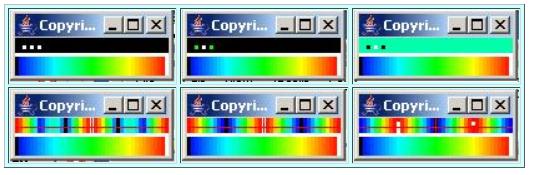 |
The leftmost pair of images in Figure 3 is similar to the leftmost pair of images in Figure 2 , except that we added a third element in Figure 3 .
All three elements in Figure 3 are weighted equally prior to summation. The separation between the left and center elements is the same as in Figure 2 . The separation between the center and right elements is the same as the separationbetween the left and center elements.
The most noticeable thing about the wavenumber response for this three-element array is that the central peak is narrower than the central peak for thetwo-element array at the left of Figure 2 . In addition, the trough between the central peak and the peaks at the ends is deeper, broader, and probably flatter (although the degree of flatness is hard to determine from this plotting format) .
Notification Switch
Would you like to follow the 'Digital signal processing - dsp' conversation and receive update notifications?

|
|

|
|

|
|

|
|

|
|
|
|
|

|
|

|
|

|
|

|