<< Chapter < Page
  Digital signal processing - dsp     Page 11 / 24
Chapter >> Page >

As mentioned earlier, the DFT algorithm is much more flexible while the FFT algorithm is much faster, particularly for large data lengths.

Peaks merge at the folding frequency

In addition to illustrating these fundamental aspects of the DFT algorithm, this example also illustrates how the mirror image peaks on either side of thefolding frequency merge into a single larger peak as the data frequency approaches the folding frequency.

The input parameters

The input parameters are shown in Figure 10 . Note in particular the values for the following parameters:

  • Data length: 200
  • Sample for zero time: 0
  • Lower frequency bound: 0.4
  • Upper frequency bound: 0.6
Figure 10. The input parameters.
Data length: 200 Sample for zero time: 0Lower frequency bound: 0.4 Upper frequency bound: 0.6Number spectra: 5 Frequencies0.492 0.4940.496 0.4980.5 Amplitudes90.0 90.090.0 90.090.0

A different data length

As you can see, the data length for this experiment is different from the data length of 400 used earlier. In addition, neither data length is a power oftwo.

Computational frequency bounds

As you can also see, the lower and upper frequency bounds are not 0.0 and 1.0 as in the earlier cases. In this case, the frequency bounds describe a muchnarrower range centered on the folding frequency.

Frequencies are close to the folding frequency

Finally, the frequencies of each of the five sinusoids specified in Figure 10 is progressively closer to the folding frequency with the frequency of the fifthsinusoid being equal to the folding frequency.

The spectral analysis output

The output from the spectral analysis for each of the five sinusoids is shown in Figure 11 . (Another interesting view of the same results is shown later in Figure 14 .)

Figure 11. Spectral analysis of five sinusoids.
missing image

Peaks are symmetrical about the folding frequency

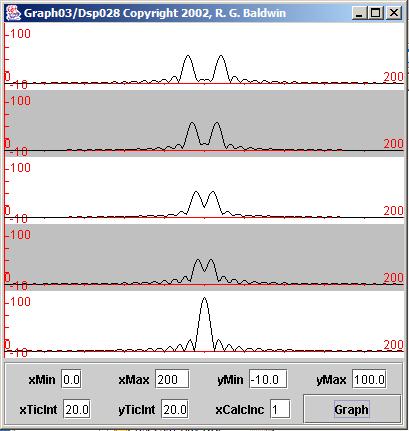
The spectral peaks shown in Figure 11 are symmetrical about the folding frequency, which in turn is centered horizontally in each of the graphs. As youalready know, the peaks are always symmetrical about the folding frequency due to the frequency folding at that frequency.

The folding frequency is centered horizontally due to the way that I defined the lower and upper frequency bounds, and the way that I adjusted the plottingparameters.

Peaks are well defined and wider than before

The peaks are well defined because I computed the spectral energy at 200 points across the specified frequency range from 0.4 to 0.6. Thus, the frequencybins at which I computed spectral energy were much narrower than before.

The peaks are wider because I displayed a much smaller slice of the entire frequency spectrum in the same physical screen space.

Peaks merge at the folding frequency

As the frequency of each sinusoid approaches the folding frequency, the two mirror-image peaks corresponding to that sinusoid merge into a single peak withtwice the height at the folding frequency. This agrees with what you saw in Figure 9 , but on a much more detailed basis.

It would be difficult to perform this experiment using an FFT algorithm because of the inherent limitations built into the algorithm. The FFT algorithmsacrifices flexibility for speed.

Questions & Answers

differentiate between demand and supply giving examples
Lambiv Reply
differentiated between demand and supply using examples
Lambiv
what is labour ?
Lambiv
how will I do?
Venny Reply
how is the graph works?I don't fully understand
Rezat Reply
information
Eliyee
devaluation
Eliyee
t
WARKISA
hi guys good evening to all
Lambiv
multiple choice question
Aster Reply
appreciation
Eliyee
explain perfect market
Lindiwe Reply
In economics, a perfect market refers to a theoretical construct where all participants have perfect information, goods are homogenous, there are no barriers to entry or exit, and prices are determined solely by supply and demand. It's an idealized model used for analysis,
Ezea
What is ceteris paribus?
Shukri Reply
other things being equal
AI-Robot
When MP₁ becomes negative, TP start to decline. Extuples Suppose that the short-run production function of certain cut-flower firm is given by: Q=4KL-0.6K2 - 0.112 • Where is quantity of cut flower produced, I is labour input and K is fixed capital input (K-5). Determine the average product of lab
Kelo
Extuples Suppose that the short-run production function of certain cut-flower firm is given by: Q=4KL-0.6K2 - 0.112 • Where is quantity of cut flower produced, I is labour input and K is fixed capital input (K-5). Determine the average product of labour (APL) and marginal product of labour (MPL)
Kelo
yes,thank you
Shukri
Can I ask you other question?
Shukri
what is monopoly mean?
Habtamu Reply
What is different between quantity demand and demand?
Shukri Reply
Quantity demanded refers to the specific amount of a good or service that consumers are willing and able to purchase at a give price and within a specific time period. Demand, on the other hand, is a broader concept that encompasses the entire relationship between price and quantity demanded
Ezea
ok
Shukri
how do you save a country economic situation when it's falling apart
Lilia Reply
what is the difference between economic growth and development
Fiker Reply
Economic growth as an increase in the production and consumption of goods and services within an economy.but Economic development as a broader concept that encompasses not only economic growth but also social & human well being.
Shukri
production function means
Jabir
What do you think is more important to focus on when considering inequality ?
Abdisa Reply
any question about economics?
Awais Reply
sir...I just want to ask one question... Define the term contract curve? if you are free please help me to find this answer 🙏
Asui
it is a curve that we get after connecting the pareto optimal combinations of two consumers after their mutually beneficial trade offs
Awais
thank you so much 👍 sir
Asui
In economics, the contract curve refers to the set of points in an Edgeworth box diagram where both parties involved in a trade cannot be made better off without making one of them worse off. It represents the Pareto efficient allocations of goods between two individuals or entities, where neither p
Cornelius
In economics, the contract curve refers to the set of points in an Edgeworth box diagram where both parties involved in a trade cannot be made better off without making one of them worse off. It represents the Pareto efficient allocations of goods between two individuals or entities,
Cornelius
Suppose a consumer consuming two commodities X and Y has The following utility function u=X0.4 Y0.6. If the price of the X and Y are 2 and 3 respectively and income Constraint is birr 50. A,Calculate quantities of x and y which maximize utility. B,Calculate value of Lagrange multiplier. C,Calculate quantities of X and Y consumed with a given price. D,alculate optimum level of output .
Feyisa Reply
Answer
Feyisa
c
Jabir
the market for lemon has 10 potential consumers, each having an individual demand curve p=101-10Qi, where p is price in dollar's per cup and Qi is the number of cups demanded per week by the i th consumer.Find the market demand curve using algebra. Draw an individual demand curve and the market dema
Gsbwnw Reply
suppose the production function is given by ( L, K)=L¼K¾.assuming capital is fixed find APL and MPL. consider the following short run production function:Q=6L²-0.4L³ a) find the value of L that maximizes output b)find the value of L that maximizes marginal product
Abdureman
types of unemployment
Yomi Reply
What is the difference between perfect competition and monopolistic competition?
Mohammed
Got questions? Join the online conversation and get instant answers!
Jobilize.com Reply

Get Jobilize Job Search Mobile App in your pocket Now!

Get it on Google Play Download on the App Store Now


Source:  OpenStax, Digital signal processing - dsp. OpenStax CNX. Jan 06, 2016 Download for free at https://legacy.cnx.org/content/col11642/1.38
Google Play and the Google Play logo are trademarks of Google Inc.

Notification Switch

Would you like to follow the 'Digital signal processing - dsp' conversation and receive update notifications?

Ask