

| << Chapter < Page | Chapter >> Page > |
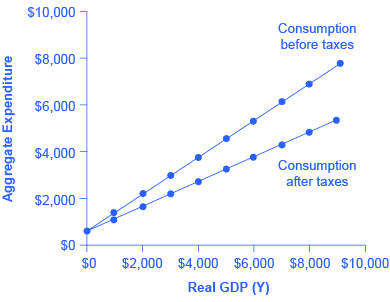
| Income | Taxes | After-Tax Income | Consumption | Savings |
|---|---|---|---|---|
| $0 | $0 | $0 | $600 | –$600 |
| $1,000 | $300 | $700 | $1,160 | –$460 |
| $2,000 | $600 | $1,400 | $1,720 | –$320 |
| $3,000 | $900 | $2,100 | $2,280 | –$180 |
| $4,000 | $1,200 | $2,800 | $2,840 | –$40 |
| $5,000 | $1,500 | $3,500 | $3,400 | $100 |
| $6,000 | $1,800 | $4,200 | $3,960 | $240 |
| $7,000 | $2,100 | $4,900 | $4,520 | $380 |
| $8,000 | $2,400 | $5,600 | $5,080 | $520 |
| $9,000 | $2,700 | $6,300 | $5,640 | $660 |
The export function, which shows how exports change with the level of a country’s own real GDP, is drawn as a horizontal line, as in the example in [link] (a) where exports are drawn at a level of $840. Again, as in the case of investment spending and government spending, drawing the export function as horizontal does not imply that exports never change. It just means that they do not change because of what is on the horizontal axis—that is, a country’s own level of domestic production—and instead are shaped by the level of aggregate demand in other countries. More demand for exports from other countries would cause the export function to shift up; less demand for exports from other countries would cause it to shift down.
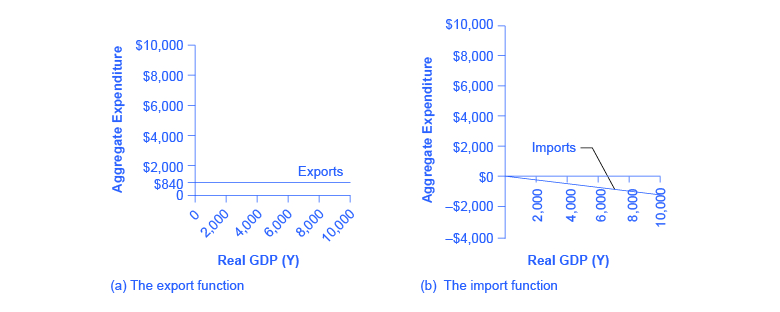
Imports are drawn in the Keynesian cross diagram as a downward-sloping line, with the downward slope determined by the marginal propensity to import (MPI), out of national income. In [link] (b), the marginal propensity to import is 0.1. Thus, if real GDP is $5,000, imports are $500; if national income is $6,000, imports are $600, and so on. The import function is drawn as downward sloping and negative, because it represents a subtraction from the aggregate expenditures in the domestic economy. A change in the marginal propensity to import, perhaps as a result of changes in preferences, would alter the slope of the import function.
In the expenditure-output or Keynesian cross model, the equilibrium occurs where the aggregate expenditure line (AE line) crosses the 45-degree line. Given algebraic equations for two lines, the point where they cross can be readily calculated. Imagine an economy with the following characteristics.
Y = Real GDP or national income
T = Taxes = 0.3Y
C = Consumption = 140 + 0.9(Y – T)
I = Investment = 400
G = Government spending = 800
X = Exports = 600
M = Imports = 0.15Y
Step 1. Determine the aggregate expenditure function. In this case, it is:
Step 2. The equation for the 45-degree line is the set of points where GDP or national income on the horizontal axis is equal to aggregate expenditure on the vertical axis. Thus, the equation for the 45-degree line is: AE = Y.
Step 3. The next step is to solve these two equations for Y (or AE, since they will be equal to each other). Substitute Y for AE:
Step 4. Insert the term 0.3Y for the tax rate T. This produces an equation with only one variable, Y.
Step 5. Work through the algebra and solve for Y.
This algebraic framework is flexible and useful in predicting how economic events and policy actions will affect real GDP.
Step 6. Say, for example, that because of changes in the relative prices of domestic and foreign goods, the marginal propensity to import falls to 0.1. Calculate the equilibrium output when the marginal propensity to import is changed to 0.1.
Step 7. Because of a surge of business confidence, investment rises to 500. Calculate the equilibrium output.
For issues of policy, the key questions would be how to adjust government spending levels or tax rates so that the equilibrium level of output is the full employment level. In this case, let the economic parameters be:
Y = National income
T = Taxes = 0.3Y
C = Consumption = 200 + 0.9(Y – T)
I = Investment = 600
G = Government spending = 1,000
X = Exports = 600
Y = Imports = 0.1(Y – T)
Step 8. Calculate the equilibrium for this economy (remember Y = AE).
Step 9. Assume that the full employment level of output is 6,000. What level of government spending would be necessary to reach that level? To answer this question, plug in 6,000 as equal to Y, but leave G as a variable, and solve for G. Thus:
Step 10. Solve this problem arithmetically. The answer is: G = 1,240. In other words, increasing government spending by 240, from its original level of 1,000, to 1,240, would raise output to the full employment level of GDP.
Indeed, the question of how much to increase government spending so that equilibrium output will rise from 5,454 to 6,000 can be answered without working through the algebra, just by using the multiplier formula. The multiplier equation in this case is:
Thus, to raise output by 546 would require an increase in government spending of 546/2.27=240, which is the same as the answer derived from the algebraic calculation.
This algebraic framework is highly flexible. For example, taxes can be treated as a total set by political considerations (like government spending) and not dependent on national income. Imports might be based on before-tax income, not after-tax income. For certain purposes, it may be helpful to analyze the economy without exports and imports. A more complicated approach could divide up consumption, investment, government, exports and imports into smaller categories, or to build in some variability in the rates of taxes, savings, and imports. A wise economist will shape the model to fit the specific question under investigation.
Notification Switch
Would you like to follow the 'Principles of macroeconomics for ap® courses' conversation and receive update notifications?

|
|
|
|
|

|
|

|
|

|
|

|
|

|
|

|
|

|
|

|
|
|
|
|
|
|