<< Chapter < Page Chapter >> Page >
  • Identify the variable to which that block applies by selecting the variable name in the pull-down list built into the block.
  • Enter a literal numeric or string value from the keyboard into the white or gray text field at the right end ofthe block, or
  • Drag some other block and drop it into the white or gray text field.

There are at least two different shapes that are eligible for being dropped into such text fields:

  1. A horizontal rectangle with rounded corners such as the orange block labeled Counter in Image 1 . (This shape seems to always be associated with a numeric or string value.)
  2. A horizontal rectangle with pointed ends as shown by several of the blocks in Image 4 . (This shape seems to always be associated with a boolean result of true or false.)

Blocks having the rounded corners are eligible for being dropped into the white text fields with rounded corners of the programming blocks in Image 1 .

Blocks having the pointed ends are eligible for being dropped into the darker orange text fields having a similar shape on the blocks that areexposed by clicking the Control button in the programming interface.

Either shape of block is eligible for being dropped into the white text fields withsquare corners shown in Image 1 . Thus the block in Image 1 that is used to set a variable to a value can set the value to a numeric value,a string value, or a boolean value.

(Note that the two variable blocks shown in Image 1 labeled Counter and counter are eligible for being dropped into the white text fields ofthe two programming blocks shown in Image 1 . This makes it possible to cause the value of one variable to depend on the valueof another variable.)

If you click the Operators button shown in Image 1 (see Image 4 ) you will expose several different blocks with rounded corners that are eligible for being dropped into thewhite text fields in Image 1 according to the rules described above.

Cause the variables to be displayed

As mentioned earlier, checking the boxes to the left of the variable names in Image 1 causes them to be displayed in the upper-left corner of the Stage shown in Image 1 . (Clicking the show and hide blocks will also check and uncheck the checkboxes, which in turn will show or hide the variables on the stage.)

Create a new variable

You create a new variable by clicking the button labeled Make a variable shown in Image 1 . When you click that button, the dialogshown in Image 2 appears on the screen asking you to provide the name for the new variable.

Image 2. dialog for entering a variable name.

Missing image
Image 2. Dialog for entering a variable name.

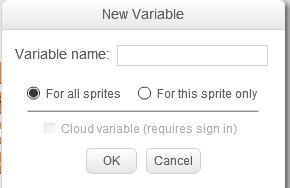
At that point, you simply type in the name for the new variable and click the OK button.

The radio buttons on that dialog allow you to specify which sprites have access to the variable.

The disabled cloud variable button (shown in light gray in Image 2 ) is a new feature of Scratch 2.0. Apparently registered users who are signed in can check that button and save the variable on the MITwebsite or on a website controlled by MIT. I wasn't signed in, which is why it was disabled.

Questions & Answers

differentiate between demand and supply giving examples
Lambiv Reply
differentiated between demand and supply using examples
Lambiv
what is labour ?
Lambiv
how will I do?
Venny Reply
how is the graph works?I don't fully understand
Rezat Reply
information
Eliyee
devaluation
Eliyee
t
WARKISA
hi guys good evening to all
Lambiv
multiple choice question
Aster Reply
appreciation
Eliyee
explain perfect market
Lindiwe Reply
In economics, a perfect market refers to a theoretical construct where all participants have perfect information, goods are homogenous, there are no barriers to entry or exit, and prices are determined solely by supply and demand. It's an idealized model used for analysis,
Ezea
What is ceteris paribus?
Shukri Reply
other things being equal
AI-Robot
When MP₁ becomes negative, TP start to decline. Extuples Suppose that the short-run production function of certain cut-flower firm is given by: Q=4KL-0.6K2 - 0.112 • Where is quantity of cut flower produced, I is labour input and K is fixed capital input (K-5). Determine the average product of lab
Kelo
Extuples Suppose that the short-run production function of certain cut-flower firm is given by: Q=4KL-0.6K2 - 0.112 • Where is quantity of cut flower produced, I is labour input and K is fixed capital input (K-5). Determine the average product of labour (APL) and marginal product of labour (MPL)
Kelo
yes,thank you
Shukri
Can I ask you other question?
Shukri
what is monopoly mean?
Habtamu Reply
What is different between quantity demand and demand?
Shukri Reply
Quantity demanded refers to the specific amount of a good or service that consumers are willing and able to purchase at a give price and within a specific time period. Demand, on the other hand, is a broader concept that encompasses the entire relationship between price and quantity demanded
Ezea
ok
Shukri
how do you save a country economic situation when it's falling apart
Lilia Reply
what is the difference between economic growth and development
Fiker Reply
Economic growth as an increase in the production and consumption of goods and services within an economy.but Economic development as a broader concept that encompasses not only economic growth but also social & human well being.
Shukri
production function means
Jabir
What do you think is more important to focus on when considering inequality ?
Abdisa Reply
any question about economics?
Awais Reply
sir...I just want to ask one question... Define the term contract curve? if you are free please help me to find this answer 🙏
Asui
it is a curve that we get after connecting the pareto optimal combinations of two consumers after their mutually beneficial trade offs
Awais
thank you so much 👍 sir
Asui
In economics, the contract curve refers to the set of points in an Edgeworth box diagram where both parties involved in a trade cannot be made better off without making one of them worse off. It represents the Pareto efficient allocations of goods between two individuals or entities, where neither p
Cornelius
In economics, the contract curve refers to the set of points in an Edgeworth box diagram where both parties involved in a trade cannot be made better off without making one of them worse off. It represents the Pareto efficient allocations of goods between two individuals or entities,
Cornelius
Suppose a consumer consuming two commodities X and Y has The following utility function u=X0.4 Y0.6. If the price of the X and Y are 2 and 3 respectively and income Constraint is birr 50. A,Calculate quantities of x and y which maximize utility. B,Calculate value of Lagrange multiplier. C,Calculate quantities of X and Y consumed with a given price. D,alculate optimum level of output .
Feyisa Reply
Answer
Feyisa
c
Jabir
the market for lemon has 10 potential consumers, each having an individual demand curve p=101-10Qi, where p is price in dollar's per cup and Qi is the number of cups demanded per week by the i th consumer.Find the market demand curve using algebra. Draw an individual demand curve and the market dema
Gsbwnw Reply
suppose the production function is given by ( L, K)=L¼K¾.assuming capital is fixed find APL and MPL. consider the following short run production function:Q=6L²-0.4L³ a) find the value of L that maximizes output b)find the value of L that maximizes marginal product
Abdureman
types of unemployment
Yomi Reply
What is the difference between perfect competition and monopolistic competition?
Mohammed
Got questions? Join the online conversation and get instant answers!
Jobilize.com Reply

Get Jobilize Job Search Mobile App in your pocket Now!

Get it on Google Play Download on the App Store Now


Source:  OpenStax, Teaching beginners to code. OpenStax CNX. May 27, 2013 Download for free at http://cnx.org/content/col11498/1.20
Google Play and the Google Play logo are trademarks of Google Inc.

Notification Switch

Would you like to follow the 'Teaching beginners to code' conversation and receive update notifications?

Ask