<< Chapter < Page Chapter >> Page >

Sosiale wetenskappe: aardrykskunde

Graad 7

Bevolkingsgroei en verandering

Module 9

Bevolkingsgroei en verandering: die impak van miv/vigs

Van die belangrikste invloede op bevolkingsverandering vandag is VIGS. Nog nooit in die geskiedenis was daar ‘n menslike ramp met dieselfde afmetings nie! Die lewensverwagting van hele bevolkings daal, kinders word in hul duisendtalle wees gelaat, armoede neem toe, produksie in bykans alle sektore van die ekonomie neem af, en dies meer.

Afrika is die vasteland wat die ergste getref is, en Suid-Afrika is die ramp ook nie gespaar nie! In die geheel gesien, nader ons ‘n tyd waar bevolkings krimp, eerder as wat daar groei is!

1. Bevolking

Om vas te stel watter invloed MIV/VIGS op die bevolking het, moet ons eers na die beskrywing van ‘n bevolking kyk.
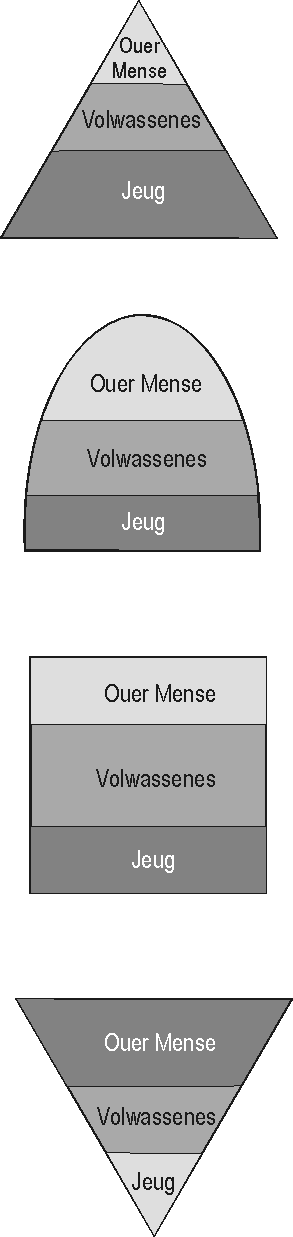
‘n Jong bevolking

Vanweë die geboortesyfer wat baie hoër is as die sterftesyfer, is daar ‘n vinnige groei in die bevolking.

‘n Volwasse bevolking

Hier oortref die geboortesyfer beswaarlik die sterftesyfer en daarom is daar ‘n baie stadige groei in die bevolking.

‘n Ou bevolking

Omdat die geboorte- en sterftesyfer naasteby ooreenkom, is by hierdie soort bevolkingsamestelling geen groei nie.

n Krimpende bevolking

Wanneer die bevolkingsamestelling so lyk, oortref die sterftesyfer die geboortesyfer en sal hierdie bevolking uitsterf.

ouer mense: 60+ volwassenes: 30 - 59 jeug: tot 29

.2. Die ideale toestand wat Suid-Afrika nastreef

’n Baie groot deel van die Suid-Afrikaanse bevolking is arm en nie behoorlik geletterd nie. ‘n Daadwerklike poging moet dus in Suid-Afrika aangewend word om armoede te verlig en geletterdheid op ‘n aanvaarbare vlak te kry. Nog ‘n ideaal is dat gesondheidsdienste verbeter en die bevolkingstoename onder beheer gebring moet word, want ons land het beperkte hulpbronne, soos byvoorbeeld ‘n tekort aan water.

Soos julle uit die grafieke hieronder kan aflei, het die lewensverwagting weens verbeterde sanitasie en mediese sorg gestyg en het die bevolkingstoename aansienlik gedaal in die 20 jaar tussen 1980 en 2000. Die dalende geboortesyfer kan gedeeltelik aan verstedeliking toegeskryf word. In Suid-Afrika het die bevolking dus van ‘n jong bevolking (met ‘n te groot toename) begin verander en is dit op die pad na ‘n meer aanvaarbare volwasse bevolking waar die toename binne perke is.

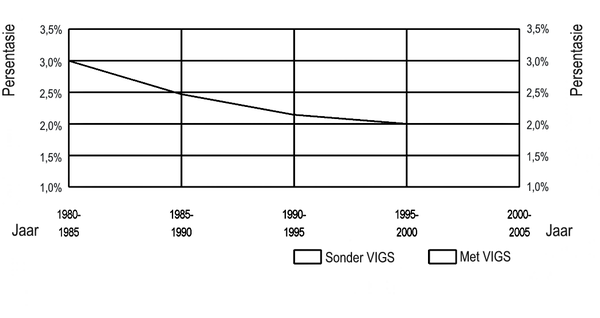
Suid-Afrika: Groei tussen 1980 en 2000

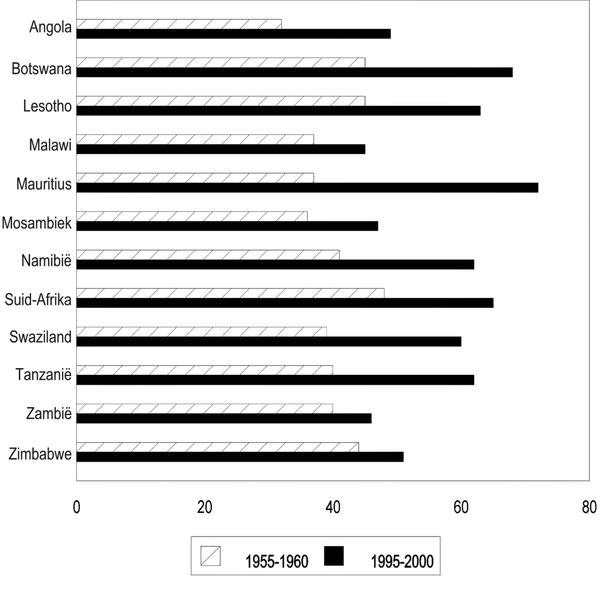
Suider-Afrikaanse Ontwikkelingsgemeenskap (SAOG): Lewensverwagting in jare

  • Verbeterde mediese sorg, higiëne en algemeen verbeterde lewensgehalte in die SAOG-lande het verseker dat die lewensverwagting van mense gestyg het.
  • As julle na die grafiek kyk, sal julle sien dat die baba wat in die laat vyftigerjare van die vorige eeu in Namibië gebore is, ‘n lewensverwagting van iets oor die 40 jaar gehad het, terwyl een wat 40 jaar later gebore is, na verwagting 20 jaar langer sou leef.

. . . . . . . . . en toe breek die MIV/VIGS-epidemie uit. Mense wat van ‘n pandemie praat, is eintlik korrek, want die siekte kom oor die hele land en vasteland, en die res van die wêreld voor!

Questions & Answers

differentiate between demand and supply giving examples
Lambiv Reply
differentiated between demand and supply using examples
Lambiv
what is labour ?
Lambiv
how will I do?
Venny Reply
how is the graph works?I don't fully understand
Rezat Reply
information
Eliyee
devaluation
Eliyee
t
WARKISA
hi guys good evening to all
Lambiv
multiple choice question
Aster Reply
appreciation
Eliyee
explain perfect market
Lindiwe Reply
In economics, a perfect market refers to a theoretical construct where all participants have perfect information, goods are homogenous, there are no barriers to entry or exit, and prices are determined solely by supply and demand. It's an idealized model used for analysis,
Ezea
What is ceteris paribus?
Shukri Reply
other things being equal
AI-Robot
When MP₁ becomes negative, TP start to decline. Extuples Suppose that the short-run production function of certain cut-flower firm is given by: Q=4KL-0.6K2 - 0.112 • Where is quantity of cut flower produced, I is labour input and K is fixed capital input (K-5). Determine the average product of lab
Kelo
Extuples Suppose that the short-run production function of certain cut-flower firm is given by: Q=4KL-0.6K2 - 0.112 • Where is quantity of cut flower produced, I is labour input and K is fixed capital input (K-5). Determine the average product of labour (APL) and marginal product of labour (MPL)
Kelo
yes,thank you
Shukri
Can I ask you other question?
Shukri
what is monopoly mean?
Habtamu Reply
What is different between quantity demand and demand?
Shukri Reply
Quantity demanded refers to the specific amount of a good or service that consumers are willing and able to purchase at a give price and within a specific time period. Demand, on the other hand, is a broader concept that encompasses the entire relationship between price and quantity demanded
Ezea
ok
Shukri
how do you save a country economic situation when it's falling apart
Lilia Reply
what is the difference between economic growth and development
Fiker Reply
Economic growth as an increase in the production and consumption of goods and services within an economy.but Economic development as a broader concept that encompasses not only economic growth but also social & human well being.
Shukri
production function means
Jabir
What do you think is more important to focus on when considering inequality ?
Abdisa Reply
any question about economics?
Awais Reply
sir...I just want to ask one question... Define the term contract curve? if you are free please help me to find this answer 🙏
Asui
it is a curve that we get after connecting the pareto optimal combinations of two consumers after their mutually beneficial trade offs
Awais
thank you so much 👍 sir
Asui
In economics, the contract curve refers to the set of points in an Edgeworth box diagram where both parties involved in a trade cannot be made better off without making one of them worse off. It represents the Pareto efficient allocations of goods between two individuals or entities, where neither p
Cornelius
In economics, the contract curve refers to the set of points in an Edgeworth box diagram where both parties involved in a trade cannot be made better off without making one of them worse off. It represents the Pareto efficient allocations of goods between two individuals or entities,
Cornelius
Suppose a consumer consuming two commodities X and Y has The following utility function u=X0.4 Y0.6. If the price of the X and Y are 2 and 3 respectively and income Constraint is birr 50. A,Calculate quantities of x and y which maximize utility. B,Calculate value of Lagrange multiplier. C,Calculate quantities of X and Y consumed with a given price. D,alculate optimum level of output .
Feyisa Reply
Answer
Feyisa
c
Jabir
the market for lemon has 10 potential consumers, each having an individual demand curve p=101-10Qi, where p is price in dollar's per cup and Qi is the number of cups demanded per week by the i th consumer.Find the market demand curve using algebra. Draw an individual demand curve and the market dema
Gsbwnw Reply
suppose the production function is given by ( L, K)=L¼K¾.assuming capital is fixed find APL and MPL. consider the following short run production function:Q=6L²-0.4L³ a) find the value of L that maximizes output b)find the value of L that maximizes marginal product
Abdureman
types of unemployment
Yomi Reply
What is the difference between perfect competition and monopolistic competition?
Mohammed
Got questions? Join the online conversation and get instant answers!
Jobilize.com Reply

Get Jobilize Job Search Mobile App in your pocket Now!

Get it on Google Play Download on the App Store Now


Source:  OpenStax, Aardrykskunde graad 7. OpenStax CNX. Sep 09, 2009 Download for free at http://cnx.org/content/col11020/1.1
Google Play and the Google Play logo are trademarks of Google Inc.

Notification Switch

Would you like to follow the 'Aardrykskunde graad 7' conversation and receive update notifications?

Ask