<< Chapter < Page Chapter >> Page >
Figure 5. Program output for Line01 for a 400x150 world.

Missing image

Draw the BLUE line

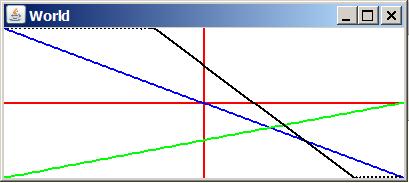
The code in Listing 3 initializes several variables and then calls a method named drawLine to implement the steps listed above to draw the BLUE line shown in Figure 3 .

Listing 3 . Draw the BLUE line. double xScale = 1.0*world.getWidth()/2; double yScale = 1.0*world.getHeight()/2;//Draw a line in BLUE. turtle.setPenColor(Color.BLUE);double slope = 1.0; double yIntercept = 0.0;drawLine(xScale,yScale,slope,yIntercept);

The method named drawLine

Once again, I will put the run method on hold while we examine the code that actually draws the line as shown in Listing 4 .

Listing 4 . The method named drawLine. void drawLine(double xScale,double yScale, double slope,double yIntercept){double yVal = 0; int row = 0;int col = 0; double xVal = -1.0;for(int cnt=0; cnt<=100;cnt++,xVal += 0.02){ //Get a y-value for a given x-value.yVal = function(xVal,slope,yIntercept);//Scale the x and y values to match the plotting surface col = (int)(xVal*xScale);row = (int)(yVal*yScale); //Move to the first point without drawing a line because the// pen is not down. Translate the origin to the center in the // process.turtle.moveTo(col + world.getWidth()/2, row + world.getHeight()/2);//Lower the pen in order to draw a line from each point to the// next point. turtle.penDown();}//end for loop }//end drawLine method

If you examine the code in Listing 4 along with values assigned to the variables in Listing 3 , you should be able to see the correlation between the code and the steps given earlier . In particular, you should be able to see how this code produces the BLUE lineshown in Figure 3 .

Note that the code in Listing 4 calls the method named function (shown in Listing 2 ) to get the values that define the line for the given slope and the given y-intercept value.

Repeat the process to draw two more lines

Returning to the run method, the code in Listing 5 repeats the process twice to draw the GREEN line and the BLACK line shown in Figure 3 for different slope and y-intercept values.

Listing 5 . Repeat the process to draw two more lines. //Draw another line in GREEN. turtle.penUp();turtle.setPenColor(Color.GREEN); slope = -0.5;yIntercept = 0.5; drawLine(xScale,yScale,slope,yIntercept);//Draw another line in BLACK.turtle.penUp(); turtle.setPenColor(Color.BLACK);slope = 2.0; yIntercept = -0.5;drawLine(xScale,yScale,slope,yIntercept); }//end run method

Listing 5 also signals the end of the run method and the end of the program.

A parabola

The program named Parabola01 shown in Listing 16 produces the graphic output shown in Figure 6 .

Figure 6. Graphic output from the program named Parabola01.

Missing image

The method named function for Parabola01

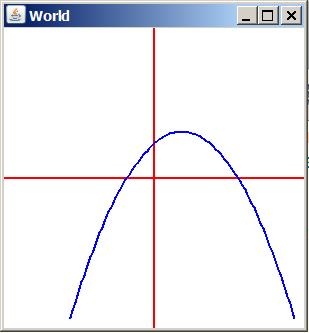
The method named function for the program named Parabola01 is shown in Listing 6 .

This method evaluates and returns the y-value for each incoming x-value for a parabola with no offsets centered at the origin as defined by the following equation:

Questions & Answers

how do you get the 2/50
Abba Reply
number of sport play by 50 student construct discrete data
Aminu Reply
width of the frangebany leaves on how to write a introduction
Theresa Reply
Solve the mean of variance
Veronica Reply
Step 1: Find the mean. To find the mean, add up all the scores, then divide them by the number of scores. ... Step 2: Find each score's deviation from the mean. ... Step 3: Square each deviation from the mean. ... Step 4: Find the sum of squares. ... Step 5: Divide the sum of squares by n – 1 or N.
kenneth
what is error
Yakuba Reply
Is mistake done to something
Vutshila
Hy
anas
hy
What is the life teble
anas
hy
Jibrin
statistics is the analyzing of data
Tajudeen Reply
what is statics?
Zelalem Reply
how do you calculate mean
Gloria Reply
diveving the sum if all values
Shaynaynay
let A1,A2 and A3 events be independent,show that (A1)^c, (A2)^c and (A3)^c are independent?
Fisaye Reply
what is statistics
Akhisani Reply
data collected all over the world
Shaynaynay
construct a less than and more than table
Imad Reply
The sample of 16 students is taken. The average age in the sample was 22 years with astandard deviation of 6 years. Construct a 95% confidence interval for the age of the population.
Aschalew Reply
Bhartdarshan' is an internet-based travel agency wherein customer can see videos of the cities they plant to visit. The number of hits daily is a normally distributed random variable with a mean of 10,000 and a standard deviation of 2,400 a. what is the probability of getting more than 12,000 hits? b. what is the probability of getting fewer than 9,000 hits?
Akshay Reply
Bhartdarshan'is an internet-based travel agency wherein customer can see videos of the cities they plan to visit. The number of hits daily is a normally distributed random variable with a mean of 10,000 and a standard deviation of 2,400. a. What is the probability of getting more than 12,000 hits
Akshay
1
Bright
Sorry i want to learn more about this question
Bright
Someone help
Bright
a= 0.20233 b=0.3384
Sufiyan
a
Shaynaynay
How do I interpret level of significance?
Mohd Reply
It depends on your business problem or in Machine Learning you could use ROC- AUC cruve to decide the threshold value
Shivam
how skewness and kurtosis are used in statistics
Owen Reply
yes what is it
Taneeya
Got questions? Join the online conversation and get instant answers!
Jobilize.com Reply

Get Jobilize Job Search Mobile App in your pocket Now!

Get it on Google Play Download on the App Store Now


Source:  OpenStax, Object-oriented programming (oop) with java. OpenStax CNX. Jun 29, 2016 Download for free at https://legacy.cnx.org/content/col11441/1.201
Google Play and the Google Play logo are trademarks of Google Inc.

Notification Switch

Would you like to follow the 'Object-oriented programming (oop) with java' conversation and receive update notifications?

Ask