

| << Chapter < Page | Chapter >> Page > |
However, moving the impulse one sample into the future (a time delay) did change the values of the real and imaginary parts of the complex spectrum.As you can see from the third plot in Figure 7 , the real part of the spectrum is no longer a replica of the amplitude spectrum. Also the imaginary part of thespectrum in the fourth plot is no longer zero across the frequency range from zero to the folding frequency.
However, the real and imaginary parts cannot change in arbitrary ways relative to one another. Recall that the amplitude spectrum at each individualfrequency is the square root of the sum of the squares of the real and imaginary parts. In order for the amplitude spectrum to stay the same, changes to the realpart of the spectrum must be accompanied by changes to the imaginary part that will maintain that relationship.
Finally, the phase angle shown in the bottom plot is no longer zero. Rather it is a straight line with a value of zero at zero frequency and a value of 180degrees at the folding frequency.
Simply shifting an impulse forward or backward in time introduces a phase shift that is linear with frequency. Shifting the pulse forward in timeintroduces a linear phase shift with a positive slope. Shifting the pulse backwards in time introduces a linear phase shift with a negative slope. In bothcases, the amount of slope depends on the amount of time shift.
A shift in time introduces a linear phase shift. Conversely, introducing a linear phase shift causes a shift in time.
Once again, consider your audio system. If your audio system introduces a phase shift across the frequency band of interest, you would probably like forthat phase shift to be linear with frequency. That will simply cause the music to be delayed in time. In other words, all frequency components in the musicwill be delayed an equal amount of time.
On the other hand, if the phase shift is not linear with frequency, some frequencies will delayed more than other frequencies. This sometimes results innoticeable phase distortion in your music.
Now let's move the impulse to the center of the eleven-sample pulse and observe the result. The new parameters are shown in Figure 8 .
| Figure 8. Introduce a large time delay. |
|---|
Parameters read from file
Data length: 400Pulse length: 11
Sample for zero time: 0Lower frequency bound: 0.0
Upper frequency bound: 0.5Pulse Values
0.00.0
0.00.0
0.0180.0
0.00.0
0.00.0
0.0 |
Figure 9 shows the result of performing a spectral analysis on the time series containing this new time-delayed impulse.
| Figure 9. Spectral analysis of impulse with five-sample delay. |
|---|
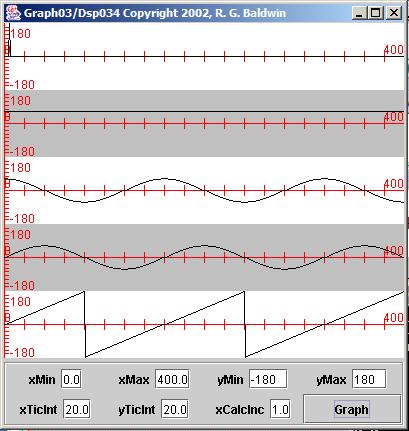 |
Finally, you can probably see the impulse on the left side of the top plot in Figure 9 without straining your eyes too much.
As we would expect, the amplitude spectrum hasn't changed.
Notification Switch
Would you like to follow the 'Digital signal processing - dsp' conversation and receive update notifications?

|
|

|
|

|
|
|
|
|

|
|

|
|

|
|
|
|

|
|

|