

| << Chapter < Page | Chapter >> Page > |
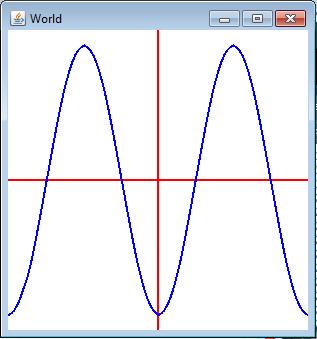
The program named Cosine01 shown in Listing 20 produces the graphic output shown in Figure 12 .
The only significant difference between this program and the program named Parabola01 is the method named function shown in Listing 14 .
double function(double xVal){
    double yVal = Math.cos(2*Math.PI*xVal);return yVal;
  }//end function
This method evaluates and returns the y-value for each incoming x-value for a cosine function with no offset centered at the origin.
y = cos(2*pi*x)
Figure 12 shows two cycles of the cosine curve, which is periodic. When viewing Figure 12 , keep in mind that positive values go down the page. Thus the positive peak of the cosine function at the origin points down.
As in the previous section, that is probably all that needs to be said about the program named Cosine01 .
I encourage you to copy the code from Listing 15 through Listing 20 . Execute the code and confirm that you get the same results as those shown in in this lesson. Experiment with the code,making changes, and observing the results of your changes. Make certain that you can explain why your changes behave as they do.
Complete listings of the programs discussed in this lesson are provided in Listing 15 through Listing 20 below.
/*File Line01 Copyright 2016 R.G.Baldwin
********************************************************************/import java.awt.Color;

public class Line01{//Driver classpublic static void main(String[] args){Line01Runner obj = new Line01Runner();
    obj.run();}//end main
}//end class Line01//=================================================================//

class Line01Runner{//Instantiate the World and Turtle objects.
  private World world = new World(300,300);private Turtle turtle = new Turtle(0,0,world);
  //---------------------------------------------------------------//public void run(){
    //Make the turtle invisibleturtle.hide();//Prepare the pen
    turtle.setPenColor(Color.RED);turtle.setPenWidth(2);//Draw the axes in RED
    turtle.penUp();turtle.moveTo(world.getWidth()/2,0);
    turtle.penDown();turtle.moveTo(world.getWidth()/2,world.getHeight());
    turtle.penUp();turtle.moveTo(world.getWidth(),world.getHeight()/2);
    turtle.penDown();turtle.moveTo(0,world.getHeight()/2);
    turtle.penUp();turtle.moveTo(0,0);

    //Prepare the scale factorsdouble xScale = 1.0*world.getWidth()/2;
    double yScale = 1.0*world.getHeight()/2;//Draw a line in BLUE.
    turtle.setPenColor(Color.BLUE);double slope = 1.0;
    double yIntercept = 0.0;drawLine(xScale,yScale,slope,yIntercept);

    //Draw another line in GREEN.turtle.penUp();
    turtle.setPenColor(Color.GREEN);slope = -0.5;
    yIntercept = 0.5;drawLine(xScale,yScale,slope,yIntercept);//Draw another line in BLACK.
    turtle.penUp();turtle.setPenColor(Color.BLACK);
    slope = 2.0;yIntercept = -0.5;
    drawLine(xScale,yScale,slope,yIntercept);}//end run method
  //---------------------------------------------------------------////Method to draw a line given several incoming parameters that// describe the line and the plotting parameters.
  void drawLine(double xScale,double yScale,double slope,double yIntercept){
    double yVal = 0;int row = 0;
    int col = 0;double xVal = -1.0;for(int cnt=0; cnt<=100;cnt++,xVal += 0.02){
      //Get a y-value for a given x-value.yVal = function(xVal,slope,yIntercept);//Scale the x and y values to match the plotting surface
      col = (int)(xVal*xScale);row = (int)(yVal*yScale);

      //Move to the first point without drawing a line because the// pen is not down. Translate the origin to the center in the
      // process.turtle.moveTo(col + world.getWidth()/2,
                                         row + world.getHeight()/2);//Lower the pen in order to draw a line from each point to the// next point.
      turtle.penDown();}//end for loop
  }//end drawLine method//---------------------------------------------------------------////This method evaluates and returns the y-value for each x-value// for a line described by the equation
  // y = slope*x + yInterceptdouble function(double xVar,double slope,double yIntercept){
    double yVar = (yIntercept) + (slope*xVar);return yVar;
}//end function//---------------------------------------------------------------//}//end class Line01Runner Notification Switch
Would you like to follow the 'Object-oriented programming (oop) with java' conversation and receive update notifications?

|
|

|
|
|
|
|

|
|

|
|

|
|

|
|

|
|

|
|

|