<< Chapter < Page
  Digital signal processing - dsp     Page 15 / 24
Chapter >> Page >
java Graph03 Dsp028

The program named Graph03 is very similar to the program named Graph06 discussed earlier. In fact, the program named Graph06 can be used to produce very similar plots where the sample values are represented by vertical bars instead of being represented byconnected dots. This results in the very interesting display shown in Figure 14 . Each of the vertical bars in Figure 14 represents a computational frequency bin. (Compare Figure 14 with Figure 11 .)

Figure 14. Output from Graph03.
missing image

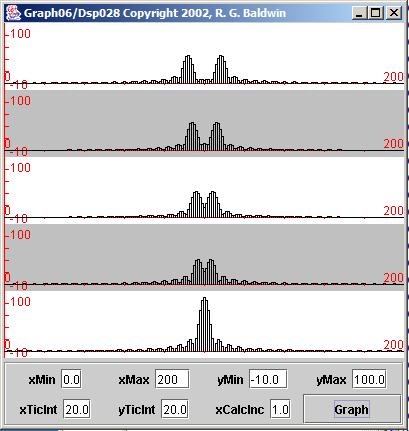
In any event, Graph03 is so similar to Graph06 that I'm not going to discuss it further. A complete listing of the programnamed Graph03 is provided in Listing 20 near the end of the module.

The transform method of the ForwardRealToComplex01 class

That brings us to the heart of this module, which is the method that actually implements the DFT algorithm and performs the spectral analysis. This is amethod named transform , which is a static method of the class named ForwardRealToComplex01 . You saw this method being called five times in the code in Listing 12 .

Will discuss in fragments

As usual, I will discuss this method in fragments. A complete listing of the class is presented in Listing 21 near the end of the module.

The transform method is a rather straightforward implementation of the concepts that I explained in the earlier module titled Fun with Java, How and Why Spectral Analysis Works . If you have not done so already, I strongly urge you go to back and study that module at this time. Youneed to understand those concepts in order for the code in the transform method to make sense.

A brief description

For those of you who don't have the time to go back and study that module in detail, a brief description of the DFT algorithm follows.

Using a notation that I described in the earlier module, the expressions that you must evaluate to determine the frequency spectral content of a target timeseries at a frequency F are shown in Figure 15 .

Figure 15. Spectral transform expressions.
Real(F) = S(n=0,N-1)[x(n)*cos(2Pi*F*n)] Imag(F) = S(n=0,N-1)[x(n)*sin(2Pi*F*n)]ComplexAmplitude(F) = Real(F) - j*Imag(F) Power(F) = Real(F)*Real(F) + Imag(F)*Imag(F)Amplitude(F) = SqRt(Power(F))

What does this really mean?

Before you panic, let me explain what this means in layman's terms. Given a time series, x(n), you can determine if that time series contains a cosinecomponent or a sine component at a given frequency, F, by doing the following:

  • Create one new time series, cos(n), which is a cosine function with the frequency F.
  • Create another new time series, sin(n), which is a sine function with the frequency F.
  • Multiply x(n) by cos(n) on a point by point basis and compute the sum of the products. Save this value, calling it Real(F). This is an estimate ofthe amplitude, if any, of the cosine component with the matching frequency contained in the time series x(n).
  • Multiply x(n) by sin(n) on a point by point basis and compute the sum of the products. Save this value, calling it Imag(f). This is an estimate ofthe amplitude, if any, of the sine component with the matching frequency contained in the time series x(n).
  • Consider the values for Real(F) and Imag(F) to be the real and imaginary parts of a complex number.
  • Consider the sum of the squares of the real and imaginary parts to represent the power at that frequency in the time series.
  • Consider the square root of the power to be the amplitude at that frequency in the time series. (This is the value that is plotted in Figure 9 , Figure 11 , and Figure 14 .)

Questions & Answers

Ayele, K., 2003. Introductory Economics, 3rd ed., Addis Ababa.
Widad Reply
can you send the book attached ?
Ariel
?
Ariel
What is economics
Widad Reply
the study of how humans make choices under conditions of scarcity
AI-Robot
U(x,y) = (x×y)1/2 find mu of x for y
Desalegn Reply
U(x,y) = (x×y)1/2 find mu of x for y
Desalegn
what is ecnomics
Jan Reply
this is the study of how the society manages it's scarce resources
Belonwu
what is macroeconomic
John Reply
macroeconomic is the branch of economics which studies actions, scale, activities and behaviour of the aggregate economy as a whole.
husaini
etc
husaini
difference between firm and industry
husaini Reply
what's the difference between a firm and an industry
Abdul
firm is the unit which transform inputs to output where as industry contain combination of firms with similar production 😅😅
Abdulraufu
Suppose the demand function that a firm faces shifted from Qd  120 3P to Qd  90  3P and the supply function has shifted from QS  20  2P to QS 10  2P . a) Find the effect of this change on price and quantity. b) Which of the changes in demand and supply is higher?
Toofiq Reply
explain standard reason why economic is a science
innocent Reply
factors influencing supply
Petrus Reply
what is economic.
Milan Reply
scares means__________________ends resources. unlimited
Jan
economics is a science that studies human behaviour as a relationship b/w ends and scares means which have alternative uses
Jan
calculate the profit maximizing for demand and supply
Zarshad Reply
Why qualify 28 supplies
Milan
what are explicit costs
Nomsa Reply
out-of-pocket costs for a firm, for example, payments for wages and salaries, rent, or materials
AI-Robot
concepts of supply in microeconomics
David Reply
economic overview notes
Amahle Reply
identify a demand and a supply curve
Salome Reply
i don't know
Parul
there's a difference
Aryan
Demand curve shows that how supply and others conditions affect on demand of a particular thing and what percent demand increase whith increase of supply of goods
Israr
Hi Sir please how do u calculate Cross elastic demand and income elastic demand?
Abari
Got questions? Join the online conversation and get instant answers!
Jobilize.com Reply

Get Jobilize Job Search Mobile App in your pocket Now!

Get it on Google Play Download on the App Store Now


Source:  OpenStax, Digital signal processing - dsp. OpenStax CNX. Jan 06, 2016 Download for free at https://legacy.cnx.org/content/col11642/1.38
Google Play and the Google Play logo are trademarks of Google Inc.

Notification Switch

Would you like to follow the 'Digital signal processing - dsp' conversation and receive update notifications?

Ask