<< Chapter < Page Chapter >> Page >

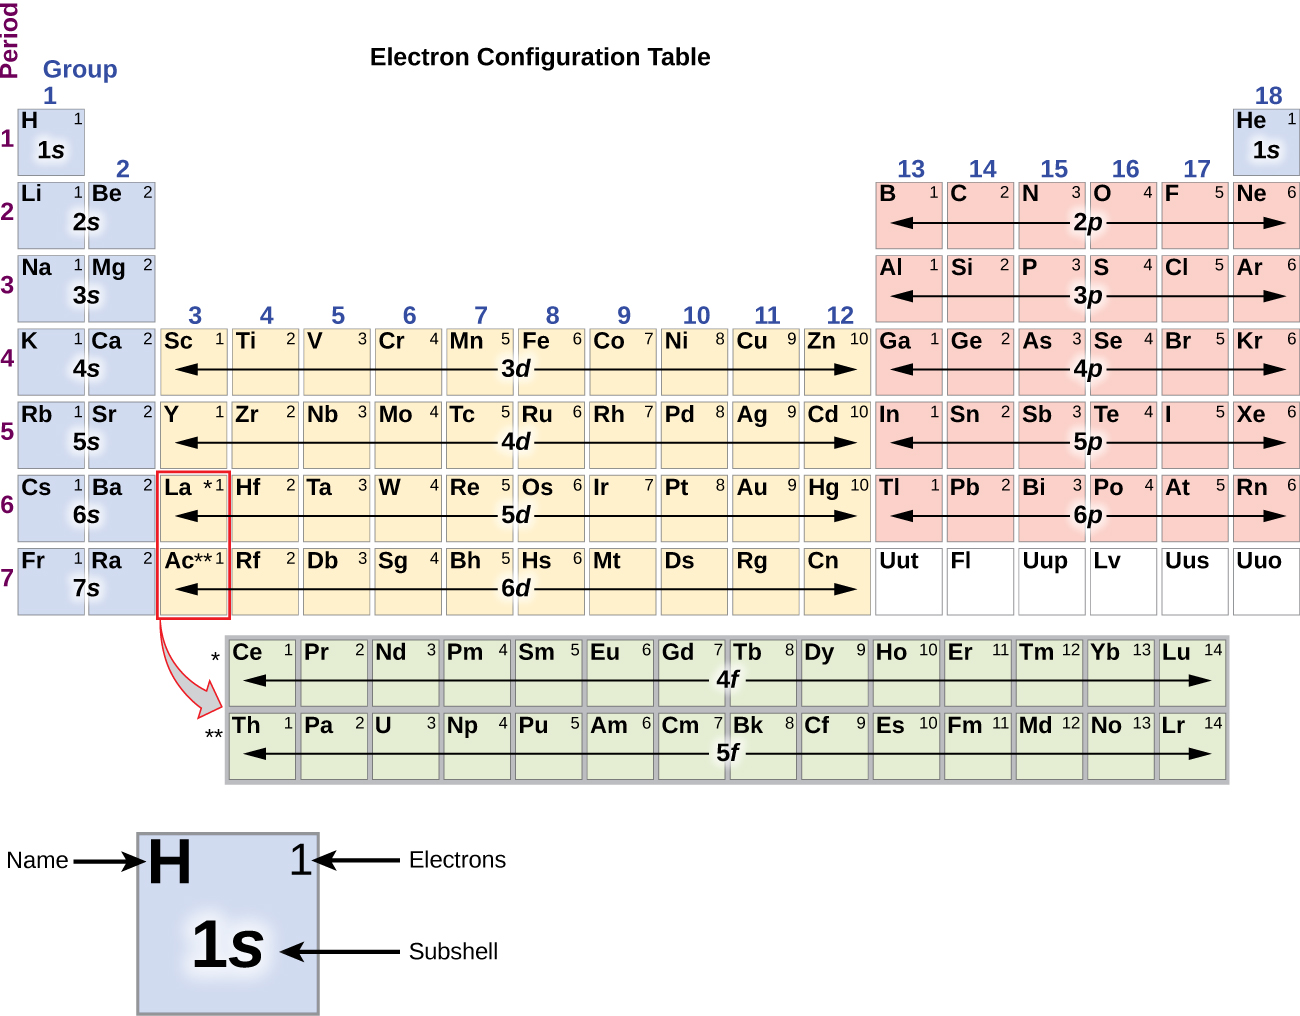
The arrangement of electrons in the orbitals of an atom is called the electron configuration    of the atom. We describe an electron configuration with a symbol that contains three pieces of information ( [link] ):

  1. The number of the principal quantum shell, n ,
  2. The letter that designates the orbital type (the subshell, l ), and
  3. A superscript number that designates the number of electrons in that particular subshell.

For example, the notation 2 p 4 (read "two–p–four") indicates four electrons in a p subshell ( l = 1) with a principal quantum number ( n ) of 2. The notation 3 d 8 (read "three–d–eight") indicates eight electrons in the d subshell (i.e., l = 2) of the principal shell for which n = 3.

A light blue hemisphere is labeled H. At a location about midway between the center and outer edge of the hemisphere, a small yellow-orange sphere is shown that is labeled with a negative sign. To the right of this diagram is the electron configuration 1 s superscript 1. The superscript is shown in a small yellow-orange circle. This superscript is labeled, “Number of electrons in subshell,” and the s is labeled, “Subshell.”
The diagram of an electron configuration specifies the subshell ( n and l value, with letter symbol) and superscript number of electrons.

The aufbau principle

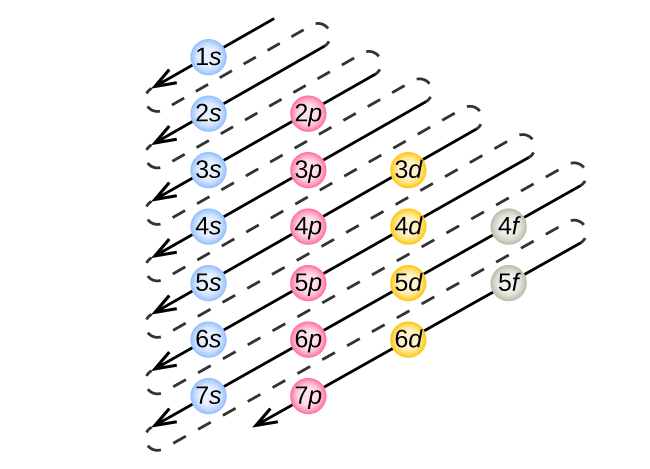
To determine the electron configuration for any particular atom, we can “build” the structures in the order of atomic numbers. Beginning with hydrogen, and continuing across the periods of the periodic table, we add one proton at a time to the nucleus and one electron to the proper subshell until we have described the electron configurations of all the elements. This procedure is called the Aufbau principle    , from the German word Aufbau (“to build up”). Each added electron occupies the subshell of lowest energy available (in the order shown in [link] ), subject to the limitations imposed by the allowed quantum numbers according to the Pauli exclusion principle. Electrons enter higher-energy subshells only after lower-energy subshells have been filled to capacity. [link] illustrates the traditional way to remember the filling order for atomic orbitals. Since the arrangement of the periodic table is based on the electron configurations, [link] provides an alternative method for determining the electron configuration. The filling order simply begins at hydrogen and includes each subshell as you proceed in increasing Z order. For example, after filling the 3 p block up to Ar, we see the orbital will be 4s (K, Ca), followed by the 3 d orbitals.

This figure includes a chart used to order the filling of electrons into atoms. At the top is a blue circle labeled “1 s.” In a row beneath this circle are 6 additional blue circles labeled “2 s” through “7 s.” A column to the right begins just right of 2 s and contains pink circles labeled 2 p through 7 p. A column to the right begins just right of 3 p and contains yellow circles labeled 3 d through 6 d. No circles are placed to the right of the 7 s and 7 p circles. A final column on the right begins right of 4 d. It includes grey circles labeled, “4 f” and, “5 f.” No circles are placed right of 6 d. Through these circles, arrows are included in the figure pointing down and to the left. The first arrow begins in the upper right and passes through 1 s. The second arrow begins just below and passes through 2 s. The third arrow passes through 2 p and 3 s. The fourth arrow passes through 3 p and 4 s. This pattern of parallel arrows pointing downward to the left continues through all circles completing the pattern 1 s 2 s 2 p 3 s 3 p 4 s 3 d 4 p 5 s 4 d 5 p 6 s 4 f 5 d 6 p 7 s 5 f 6 d 7 p.
The arrow leads through each subshell in the appropriate filling order for electron configurations. This chart is straightforward to construct. Simply make a column for all the s orbitals with each n shell on a separate row. Repeat for p , d , and f . Be sure to only include orbitals allowed by the quantum numbers (no 1 p or 2 d , and so forth). Finally, draw diagonal lines from top to bottom as shown.
In this figure, a periodic table is shown that is entitled, “Electron Configuration Table.” Beneath the table, a square for the element hydrogen is shown enlarged to provide detail. The element symbol, H, is placed in the upper left corner. In the upper right is the number of electrons, 1. The lower central portion of the element square contains the subshell, 1 s. Helium and elements in groups 1 and 2 are shaded blue. In this region, the rows are labeled 1 s through 7 s moving down the table. Groups 3 through 12 are shaded orange, and the rows are labeled 3 d through 6 d moving down the table. Groups 13 through 18, except helium, are shaded pink and are labeled 2 p through 6 p moving down the table. The lanthanide and actinide series across the bottom of the table are shaded grey and are labeled 4 f and 5 f respectively.
This periodic table shows the electron configuration for each subshell. By “building up” from hydrogen, this table can be used to determine the electron configuration for any atom on the periodic table.

We will now construct the ground-state electron configuration and orbital diagram for a selection of atoms in the first and second periods of the periodic table. Orbital diagrams are pictorial representations of the electron configuration, showing the individual orbitals and the pairing arrangement of electrons. We start with a single hydrogen atom (atomic number 1), which consists of one proton and one electron. Referring to [link] or [link] , we would expect to find the electron in the 1 s orbital. By convention, the m s = + 1 2 value is usually filled first. The electron configuration and the orbital diagram are:

Questions & Answers

how do you get the 2/50
Abba Reply
number of sport play by 50 student construct discrete data
Aminu Reply
width of the frangebany leaves on how to write a introduction
Theresa Reply
Solve the mean of variance
Veronica Reply
Step 1: Find the mean. To find the mean, add up all the scores, then divide them by the number of scores. ... Step 2: Find each score's deviation from the mean. ... Step 3: Square each deviation from the mean. ... Step 4: Find the sum of squares. ... Step 5: Divide the sum of squares by n – 1 or N.
kenneth
what is error
Yakuba Reply
Is mistake done to something
Vutshila
Hy
anas
hy
What is the life teble
anas
hy
Jibrin
statistics is the analyzing of data
Tajudeen Reply
what is statics?
Zelalem Reply
how do you calculate mean
Gloria Reply
diveving the sum if all values
Shaynaynay
let A1,A2 and A3 events be independent,show that (A1)^c, (A2)^c and (A3)^c are independent?
Fisaye Reply
what is statistics
Akhisani Reply
data collected all over the world
Shaynaynay
construct a less than and more than table
Imad Reply
The sample of 16 students is taken. The average age in the sample was 22 years with astandard deviation of 6 years. Construct a 95% confidence interval for the age of the population.
Aschalew Reply
Bhartdarshan' is an internet-based travel agency wherein customer can see videos of the cities they plant to visit. The number of hits daily is a normally distributed random variable with a mean of 10,000 and a standard deviation of 2,400 a. what is the probability of getting more than 12,000 hits? b. what is the probability of getting fewer than 9,000 hits?
Akshay Reply
Bhartdarshan'is an internet-based travel agency wherein customer can see videos of the cities they plan to visit. The number of hits daily is a normally distributed random variable with a mean of 10,000 and a standard deviation of 2,400. a. What is the probability of getting more than 12,000 hits
Akshay
1
Bright
Sorry i want to learn more about this question
Bright
Someone help
Bright
a= 0.20233 b=0.3384
Sufiyan
a
Shaynaynay
How do I interpret level of significance?
Mohd Reply
It depends on your business problem or in Machine Learning you could use ROC- AUC cruve to decide the threshold value
Shivam
how skewness and kurtosis are used in statistics
Owen Reply
yes what is it
Taneeya
Got questions? Join the online conversation and get instant answers!
Jobilize.com Reply
Practice Key Terms 7

Get Jobilize Job Search Mobile App in your pocket Now!

Get it on Google Play Download on the App Store Now


Source:  OpenStax, Chemistry. OpenStax CNX. May 20, 2015 Download for free at http://legacy.cnx.org/content/col11760/1.9
Google Play and the Google Play logo are trademarks of Google Inc.

Notification Switch

Would you like to follow the 'Chemistry' conversation and receive update notifications?

Ask