<< Chapter < Page Chapter >> Page >

The following ideas are important in understanding hybridization:

  1. Hybrid orbitals do not exist in isolated atoms. They are formed only in covalently bonded atoms.
  2. Hybrid orbitals have shapes and orientations that are very different from those of the atomic orbitals in isolated atoms.
  3. A set of hybrid orbitals is generated by combining atomic orbitals. The number of hybrid orbitals in a set is equal to the number of atomic orbitals that were combined to produce the set.
  4. All orbitals in a set of hybrid orbitals are equivalent in shape and energy.
  5. The type of hybrid orbitals formed in a bonded atom depends on its electron-pair geometry as predicted by the VSEPR theory.
  6. Hybrid orbitals overlap to form σ bonds. Unhybridized orbitals overlap to form π bonds.

In the following sections, we shall discuss the common types of hybrid orbitals.

sp Hybridization

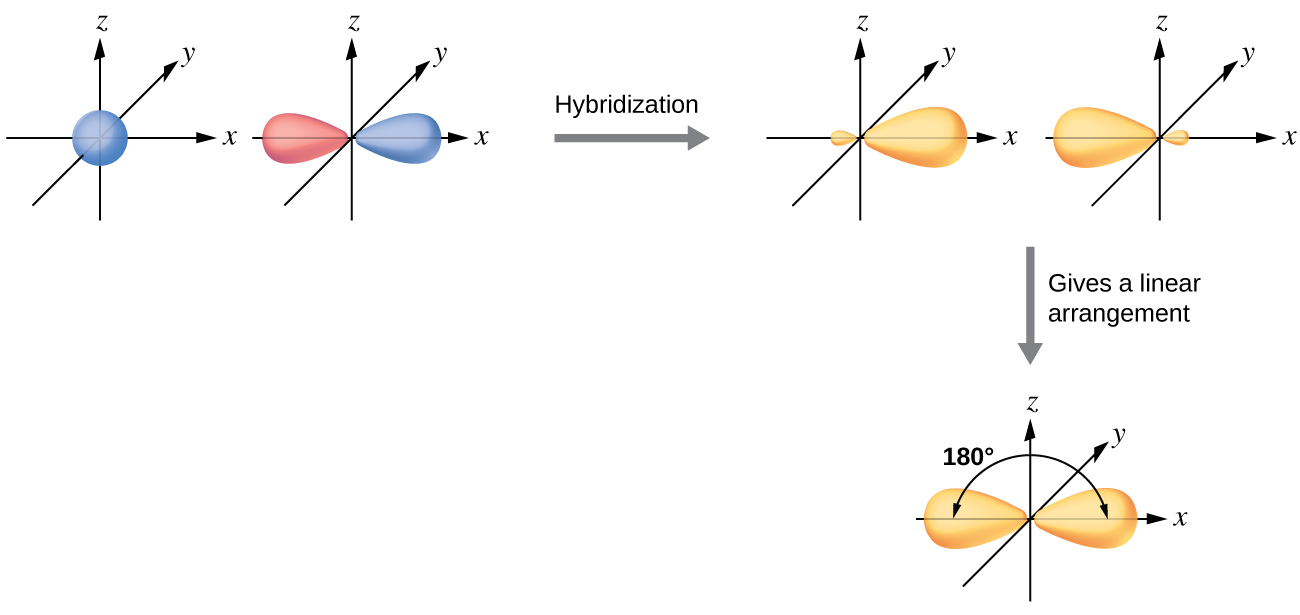
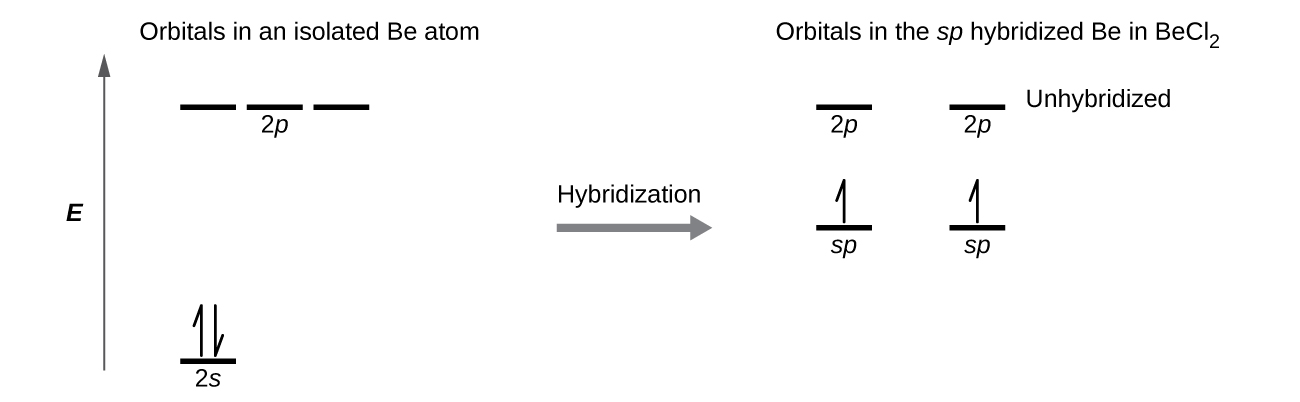
The beryllium atom in a gaseous BeCl 2 molecule is an example of a central atom with no lone pairs of electrons in a linear arrangement of three atoms. There are two regions of valence electron density in the BeCl 2 molecule that correspond to the two covalent Be–Cl bonds. To accommodate these two electron domains, two of the Be atom’s four valence orbitals will mix to yield two hybrid orbitals. This hybridization process involves mixing of the valence s orbital with one of the valence p orbitals to yield two equivalent sp hybrid orbitals that are oriented in a linear geometry ( [link] ). In this figure, the set of sp orbitals appears similar in shape to the original p orbital, but there is an important difference. The number of atomic orbitals combined always equals the number of hybrid orbitals formed. The p orbital is one orbital that can hold up to two electrons. The sp set is two equivalent orbitals that point 180° from each other. The two electrons that were originally in the s orbital are now distributed to the two sp orbitals, which are half filled. In gaseous BeCl 2 , these half-filled hybrid orbitals will overlap with orbitals from the chlorine atoms to form two identical σ bonds.

A series of three diagrams connected by a right-facing arrow that is labeled, “Hybridization,” and a downward-facing arrow labeled, “Gives a linear arrangement,” are shown. The first diagram shows a blue spherical orbital and a red, peanut-shaped orbital, each placed on an X, Y, Z axis system. The second diagram shows the same two orbitals, but they are now purple and have one enlarged lobe and one smaller lobe. Each lies along the x-axis in the drawing. The third diagram shows the same two orbitals, but their smaller lobes now overlap along the x-axis while their larger lobes are located at and labeled as “180 degrees” from one another.
Hybridization of an s orbital (blue) and a p orbital (red) of the same atom produces two sp hybrid orbitals (purple). Each hybrid orbital is oriented primarily in just one direction. Note that each sp orbital contains one lobe that is significantly larger than the other. The set of two sp orbitals are oriented at 180°, which is consistent with the geometry for two domains.

We illustrate the electronic differences in an isolated Be atom and in the bonded Be atom in the orbital energy-level diagram in [link] . These diagrams represent each orbital by a horizontal line (indicating its energy) and each electron by an arrow. Energy increases toward the top of the diagram. We use one upward arrow to indicate one electron in an orbital and two arrows (up and down) to indicate two electrons of opposite spin.

A diagram is shown in two parts, connected by a right facing arrow labeled, “Hybridization.” The left diagram shows an up-facing arrow labeled, “E.” To the lower right of the arrow is a short, horizontal line labeled, “2 s,” that has two vertical half-arrows facing up and down on it. To the upper right of the arrow are a series of three short, horizontal lines labeled, “2 p.” Above these two sets of lines is the phrase, “Orbitals in an isolated B e atom.” The right side of the diagram shows two short, horizontal lines placed halfway up the space and each labeled, “s p.” An upward-facing half arrow is drawn vertically on each line. Above these lines are two other short, horizontal lines, each labeled, “2 p.” Above these two sets of lines is the phrase, “Orbitals in the s p hybridized B e in B e C l subscript 2.”
This orbital energy-level diagram shows the sp hybridized orbitals on Be in the linear BeCl 2 molecule. Each of the two sp hybrid orbitals holds one electron and is thus half filled and available for bonding via overlap with a Cl 3 p orbital.

Questions & Answers

What is inflation
Bright Reply
a general and ongoing rise in the level of prices in an economy
AI-Robot
What are the factors that affect demand for a commodity
Florence Reply
differentiate between demand and supply giving examples
Lambiv Reply
differentiated between demand and supply using examples
Lambiv
what is labour ?
Lambiv
how will I do?
Venny Reply
how is the graph works?I don't fully understand
Rezat Reply
information
Eliyee
devaluation
Eliyee
t
WARKISA
hi guys good evening to all
Lambiv
multiple choice question
Aster Reply
appreciation
Eliyee
explain perfect market
Lindiwe Reply
In economics, a perfect market refers to a theoretical construct where all participants have perfect information, goods are homogenous, there are no barriers to entry or exit, and prices are determined solely by supply and demand. It's an idealized model used for analysis,
Ezea
What is ceteris paribus?
Shukri Reply
other things being equal
AI-Robot
When MP₁ becomes negative, TP start to decline. Extuples Suppose that the short-run production function of certain cut-flower firm is given by: Q=4KL-0.6K2 - 0.112 • Where is quantity of cut flower produced, I is labour input and K is fixed capital input (K-5). Determine the average product of lab
Kelo
Extuples Suppose that the short-run production function of certain cut-flower firm is given by: Q=4KL-0.6K2 - 0.112 • Where is quantity of cut flower produced, I is labour input and K is fixed capital input (K-5). Determine the average product of labour (APL) and marginal product of labour (MPL)
Kelo
yes,thank you
Shukri
Can I ask you other question?
Shukri
what is monopoly mean?
Habtamu Reply
What is different between quantity demand and demand?
Shukri Reply
Quantity demanded refers to the specific amount of a good or service that consumers are willing and able to purchase at a give price and within a specific time period. Demand, on the other hand, is a broader concept that encompasses the entire relationship between price and quantity demanded
Ezea
ok
Shukri
how do you save a country economic situation when it's falling apart
Lilia Reply
what is the difference between economic growth and development
Fiker Reply
Economic growth as an increase in the production and consumption of goods and services within an economy.but Economic development as a broader concept that encompasses not only economic growth but also social & human well being.
Shukri
production function means
Jabir
What do you think is more important to focus on when considering inequality ?
Abdisa Reply
any question about economics?
Awais Reply
sir...I just want to ask one question... Define the term contract curve? if you are free please help me to find this answer 🙏
Asui
it is a curve that we get after connecting the pareto optimal combinations of two consumers after their mutually beneficial trade offs
Awais
thank you so much 👍 sir
Asui
In economics, the contract curve refers to the set of points in an Edgeworth box diagram where both parties involved in a trade cannot be made better off without making one of them worse off. It represents the Pareto efficient allocations of goods between two individuals or entities, where neither p
Cornelius
In economics, the contract curve refers to the set of points in an Edgeworth box diagram where both parties involved in a trade cannot be made better off without making one of them worse off. It represents the Pareto efficient allocations of goods between two individuals or entities,
Cornelius
Suppose a consumer consuming two commodities X and Y has The following utility function u=X0.4 Y0.6. If the price of the X and Y are 2 and 3 respectively and income Constraint is birr 50. A,Calculate quantities of x and y which maximize utility. B,Calculate value of Lagrange multiplier. C,Calculate quantities of X and Y consumed with a given price. D,alculate optimum level of output .
Feyisa Reply
Answer
Feyisa
c
Jabir
Got questions? Join the online conversation and get instant answers!
Jobilize.com Reply
Practice Key Terms 7

Get Jobilize Job Search Mobile App in your pocket Now!

Get it on Google Play Download on the App Store Now


Source:  OpenStax, Chemistry. OpenStax CNX. May 20, 2015 Download for free at http://legacy.cnx.org/content/col11760/1.9
Google Play and the Google Play logo are trademarks of Google Inc.

Notification Switch

Would you like to follow the 'Chemistry' conversation and receive update notifications?

Ask