<< Chapter < Page Chapter >> Page >

Phase diagram for an aqueous solution of a nonelectrolyte

The colligative effects on vapor pressure, boiling point, and freezing point described in the previous section are conveniently summarized by comparing the phase diagrams for a pure liquid and a solution derived from that liquid. Phase diagrams for water and an aqueous solution are shown in [link] .

This phase diagram indicates the pressure in atmospheres of water and a solution at various temperatures. The graph shows the freezing point of water and the freezing point of the solution, with the difference between these two values identified as delta T subscript f. The graph shows the boiling point of water and the boiling point of the solution, with the difference between these two values identified as delta T subscript b. Similarly, the difference in the pressure of water and the solution at the boiling point of water is shown and identified as delta P. This difference in pressure is labeled vapor pressure lowering. The lower level of the vapor pressure curve for the solution as opposed to that of pure water shows vapor pressure lowering in the solution. Background colors on the diagram indicate the presence of water and the solution in the solid state to the left, liquid state in the central upper region, and gas to the right.
These phase diagrams show water (solid curves) and an aqueous solution of nonelectrolyte (dashed curves).

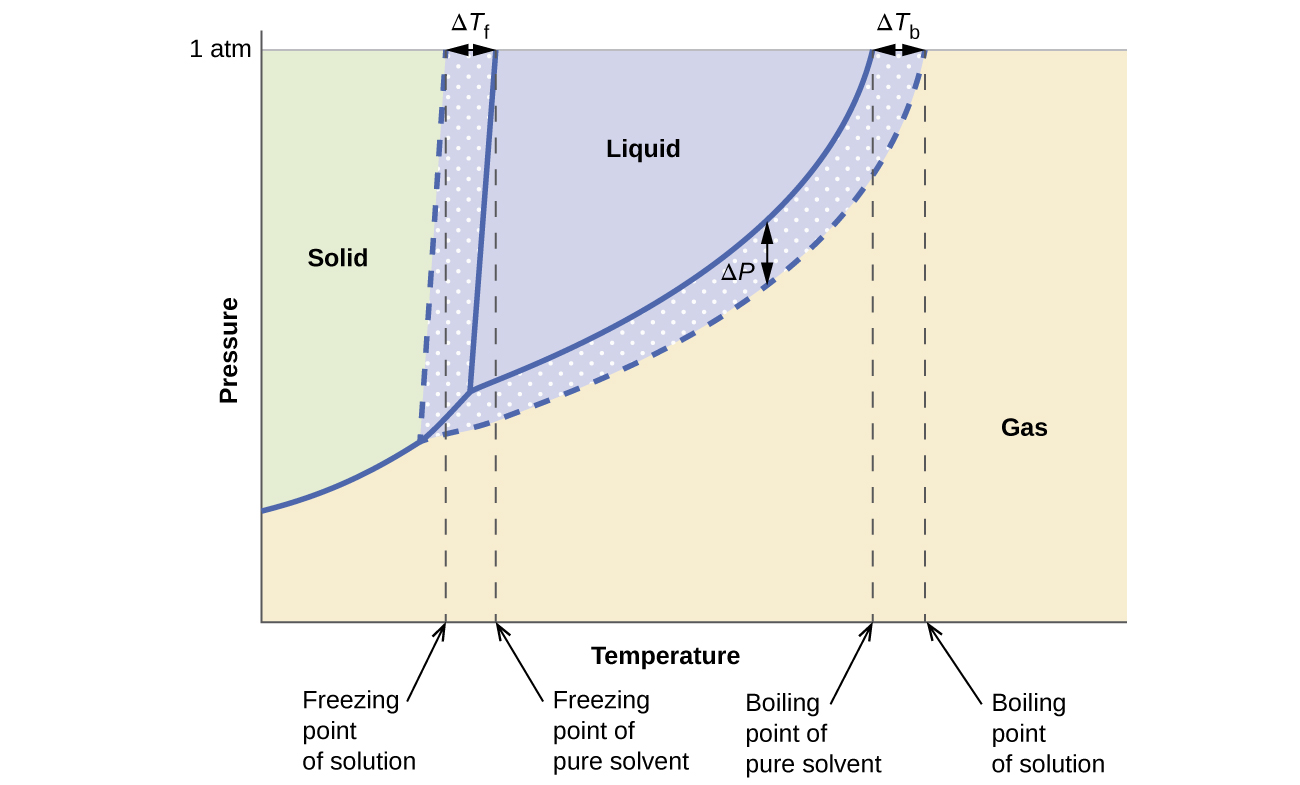
The liquid-vapor curve for the solution is located beneath the corresponding curve for the solvent, depicting the vapor pressure lowering , Δ P , that results from the dissolution of nonvolatile solute. Consequently, at any given pressure, the solution’s boiling point is observed at a higher temperature than that for the pure solvent, reflecting the boiling point elevation, Δ T b , associated with the presence of nonvolatile solute. The solid-liquid curve for the solution is displaced left of that for the pure solvent, representing the freezing point depression, Δ T b , that accompanies solution formation. Finally, notice that the solid-gas curves for the solvent and its solution are identical. This is the case for many solutions comprising liquid solvents and nonvolatile solutes. Just as for vaporization, when a solution of this sort is frozen, it is actually just the solvent molecules that undergo the liquid-to-solid transition, forming pure solid solvent that excludes solute species. The solid and gaseous phases, therefore, are composed solvent only, and so transitions between these phases are not subject to colligative effects.

Osmosis and osmotic pressure of solutions

A number of natural and synthetic materials exhibit selective permeation , meaning that only molecules or ions of a certain size, shape, polarity, charge, and so forth, are capable of passing through (permeating) the material. Biological cell membranes provide elegant examples of selective permeation in nature, while dialysis tubing used to remove metabolic wastes from blood is a more simplistic technological example. Regardless of how they may be fabricated, these materials are generally referred to as semipermeable membranes .

Consider the apparatus illustrated in [link] , in which samples of pure solvent and a solution are separated by a membrane that only solvent molecules may permeate. Solvent molecules will diffuse across the membrane in both directions. Since the concentration of solvent is greater in the pure solvent than the solution, these molecules will diffuse from the solvent side of the membrane to the solution side at a faster rate than they will in the reverse direction. The result is a net transfer of solvent molecules from the pure solvent to the solution. Diffusion-driven transfer of solvent molecules through a semipermeable membrane is a process known as osmosis    .

The figure shows two U shaped tubes with a semi permeable membrane placed at the base of the U. In figure a, pure solvent is present and indicated by small yellow spheres to the left of the membrane. To the right, a solution exists with larger blue spheres intermingled with some small yellow spheres. At the membrane, arrows pointing from three small yellow spheres on both sides of the membrane cross over the membrane. An arrow drawn from one of the large blue spheres does not cross the membrane, but rather is reflected back from the surface of the membrane. The levels of liquid in both sides of the U shaped tube are equal. In figure b, arrows again point from small yellow spheres across the semipermeable membrane from both sides. This diagram shows the level of liquid in the left, pure solvent, side to be significantly lower than the liquid level on the right. Dashed lines are drawn from these two liquid levels into the middle of the U-shaped tube and between them is the term osmotic pressure.
Osmosis results in the transfer of solvent molecules from a sample of low (or zero) solute concentration to a sample of higher solute concentration.

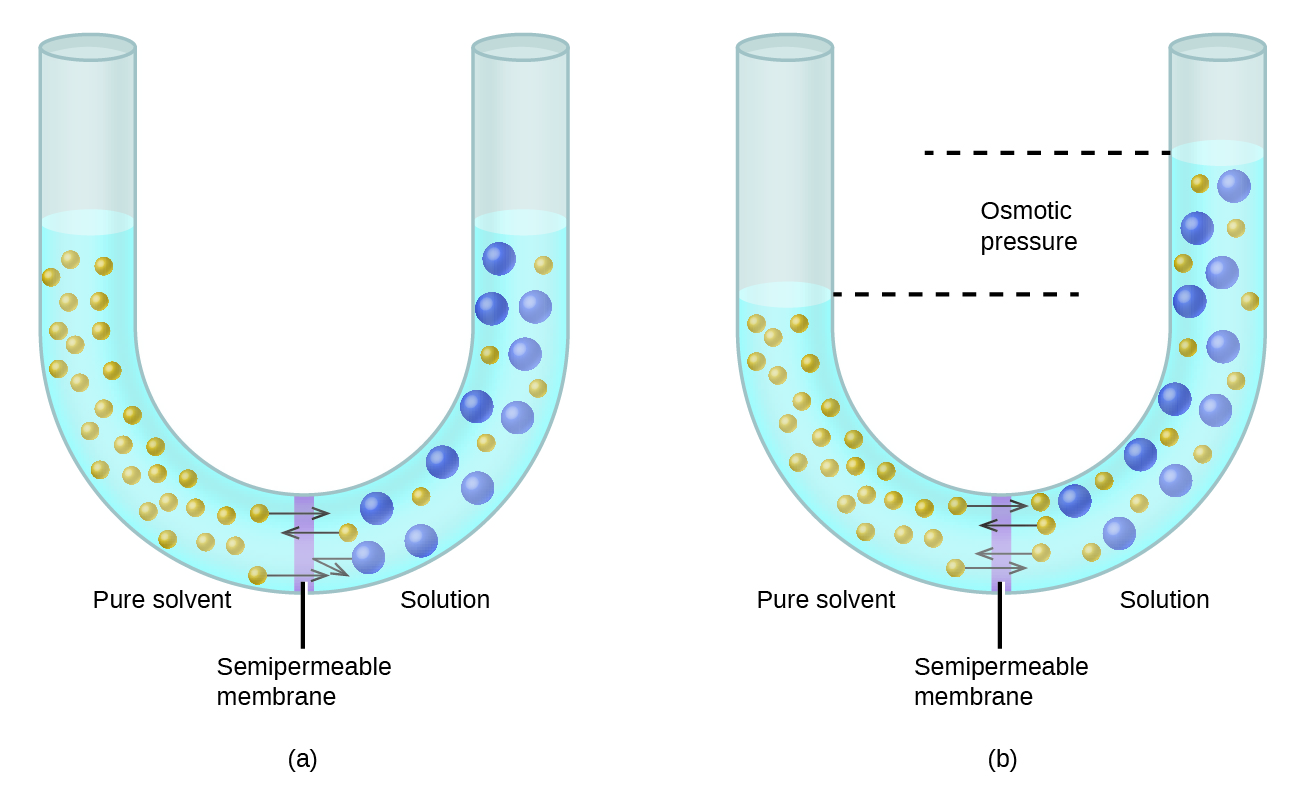
When osmosis is carried out in an apparatus like that shown in [link] , the volume of the solution increases as it becomes diluted by accumulation of solvent. This causes the level of the solution to rise, increasing its hydrostatic pressure (due to the weight of the column of solution in the tube) and resulting in a faster transfer of solvent molecules back to the pure solvent side. When the pressure reaches a value that yields a reverse solvent transfer rate equal to the osmosis rate, bulk transfer of solvent ceases. This pressure is called the osmotic pressure ( Π )    of the solution. The osmotic pressure of a dilute solution is related to its solute molarity, M , and absolute temperature, T , according to the equation

Questions & Answers

A golfer on a fairway is 70 m away from the green, which sits below the level of the fairway by 20 m. If the golfer hits the ball at an angle of 40° with an initial speed of 20 m/s, how close to the green does she come?
Aislinn Reply
cm
tijani
what is titration
John Reply
what is physics
Siyaka Reply
A mouse of mass 200 g falls 100 m down a vertical mine shaft and lands at the bottom with a speed of 8.0 m/s. During its fall, how much work is done on the mouse by air resistance
Jude Reply
Can you compute that for me. Ty
Jude
what is the dimension formula of energy?
David Reply
what is viscosity?
David
what is inorganic
emma Reply
what is chemistry
Youesf Reply
what is inorganic
emma
Chemistry is a branch of science that deals with the study of matter,it composition,it structure and the changes it undergoes
Adjei
please, I'm a physics student and I need help in physics
Adjanou
chemistry could also be understood like the sexual attraction/repulsion of the male and female elements. the reaction varies depending on the energy differences of each given gender. + masculine -female.
Pedro
A ball is thrown straight up.it passes a 2.0m high window 7.50 m off the ground on it path up and takes 1.30 s to go past the window.what was the ball initial velocity
Krampah Reply
2. A sled plus passenger with total mass 50 kg is pulled 20 m across the snow (0.20) at constant velocity by a force directed 25° above the horizontal. Calculate (a) the work of the applied force, (b) the work of friction, and (c) the total work.
Sahid Reply
you have been hired as an espert witness in a court case involving an automobile accident. the accident involved car A of mass 1500kg which crashed into stationary car B of mass 1100kg. the driver of car A applied his brakes 15 m before he skidded and crashed into car B. after the collision, car A s
Samuel Reply
can someone explain to me, an ignorant high school student, why the trend of the graph doesn't follow the fact that the higher frequency a sound wave is, the more power it is, hence, making me think the phons output would follow this general trend?
Joseph Reply
Nevermind i just realied that the graph is the phons output for a person with normal hearing and not just the phons output of the sound waves power, I should read the entire thing next time
Joseph
Follow up question, does anyone know where I can find a graph that accuretly depicts the actual relative "power" output of sound over its frequency instead of just humans hearing
Joseph
"Generation of electrical energy from sound energy | IEEE Conference Publication | IEEE Xplore" ***ieeexplore.ieee.org/document/7150687?reload=true
Ryan
what's motion
Maurice Reply
what are the types of wave
Maurice
answer
Magreth
progressive wave
Magreth
hello friend how are you
Muhammad Reply
fine, how about you?
Mohammed
hi
Mujahid
A string is 3.00 m long with a mass of 5.00 g. The string is held taut with a tension of 500.00 N applied to the string. A pulse is sent down the string. How long does it take the pulse to travel the 3.00 m of the string?
yasuo Reply
Who can show me the full solution in this problem?
Reofrir Reply
Got questions? Join the online conversation and get instant answers!
Jobilize.com Reply

Get Jobilize Job Search Mobile App in your pocket Now!

Get it on Google Play Download on the App Store Now


Source:  OpenStax, Chemistry. OpenStax CNX. May 20, 2015 Download for free at http://legacy.cnx.org/content/col11760/1.9
Google Play and the Google Play logo are trademarks of Google Inc.

Notification Switch

Would you like to follow the 'Chemistry' conversation and receive update notifications?

Ask