<< Chapter < Page Chapter >> Page >

Comparison of ideal gas law and van der waals equation

A 4.25-L flask contains 3.46 mol CO 2 at 229 °C. Calculate the pressure of this sample of CO 2 :

(a) from the ideal gas law

(b) from the van der Waals equation

(c) Explain the reason(s) for the difference.

Solution

(a) From the ideal gas law:

P = n R T V = 3.46 mol × 0.08206 L atm mol −1 K −1 × 502 K 4.25 L = 33.5 atm

(b) From the van der Waals equation:

( P + n 2 a V 2 ) × ( V n b ) = n R T P = n R T ( V n b ) n 2 a V 2
P = 3.46 mol × 0.08206 L atm mol −1 K −1 × 502 K ( 4.25 L 3.46 mol × 0.0427 L mol −1 ) ( 3.46 mol ) 2 × 3.59 L 2 atm mol 2 ( 4.25 L ) 2

This finally yields P = 32.4 atm.

(c) This is not very different from the value from the ideal gas law because the pressure is not very high and the temperature is not very low. The value is somewhat different because CO 2 molecules do have some volume and attractions between molecules, and the ideal gas law assumes they do not have volume or attractions.

Check your learning

A 560-mL flask contains 21.3 g N 2 at 145 °C. Calculate the pressure of N 2 :

(a) from the ideal gas law

(b) from the van der Waals equation

(c) Explain the reason(s) for the difference.

Answer:

(a) 46.562 atm; (b) 46.594 atm; (c) The van der Waals equation takes into account the volume of the gas molecules themselves as well as intermolecular attractions.

Got questions? Get instant answers now!

Key concepts and summary

Gas molecules possess a finite volume and experience forces of attraction for one another. Consequently, gas behavior is not necessarily described well by the ideal gas law. Under conditions of low pressure and high temperature, these factors are negligible, the ideal gas equation is an accurate description of gas behavior, and the gas is said to exhibit ideal behavior. However, at lower temperatures and higher pressures, corrections for molecular volume and molecular attractions are required to account for finite molecular size and attractive forces. The van der Waals equation is a modified version of the ideal gas law that can be used to account for the non-ideal behavior of gases under these conditions.

Key equations

  • Z = molar volume of gas at same T and P molar volume of ideal gas at same T and P = ( P × V m R × T ) measured
  • ( P + n 2 a V 2 ) × ( V n b ) = n R T

Chemistry end of chapter exercises

Graphs showing the behavior of several different gases follow. Which of these gases exhibit behavior significantly different from that expected for ideal gases?
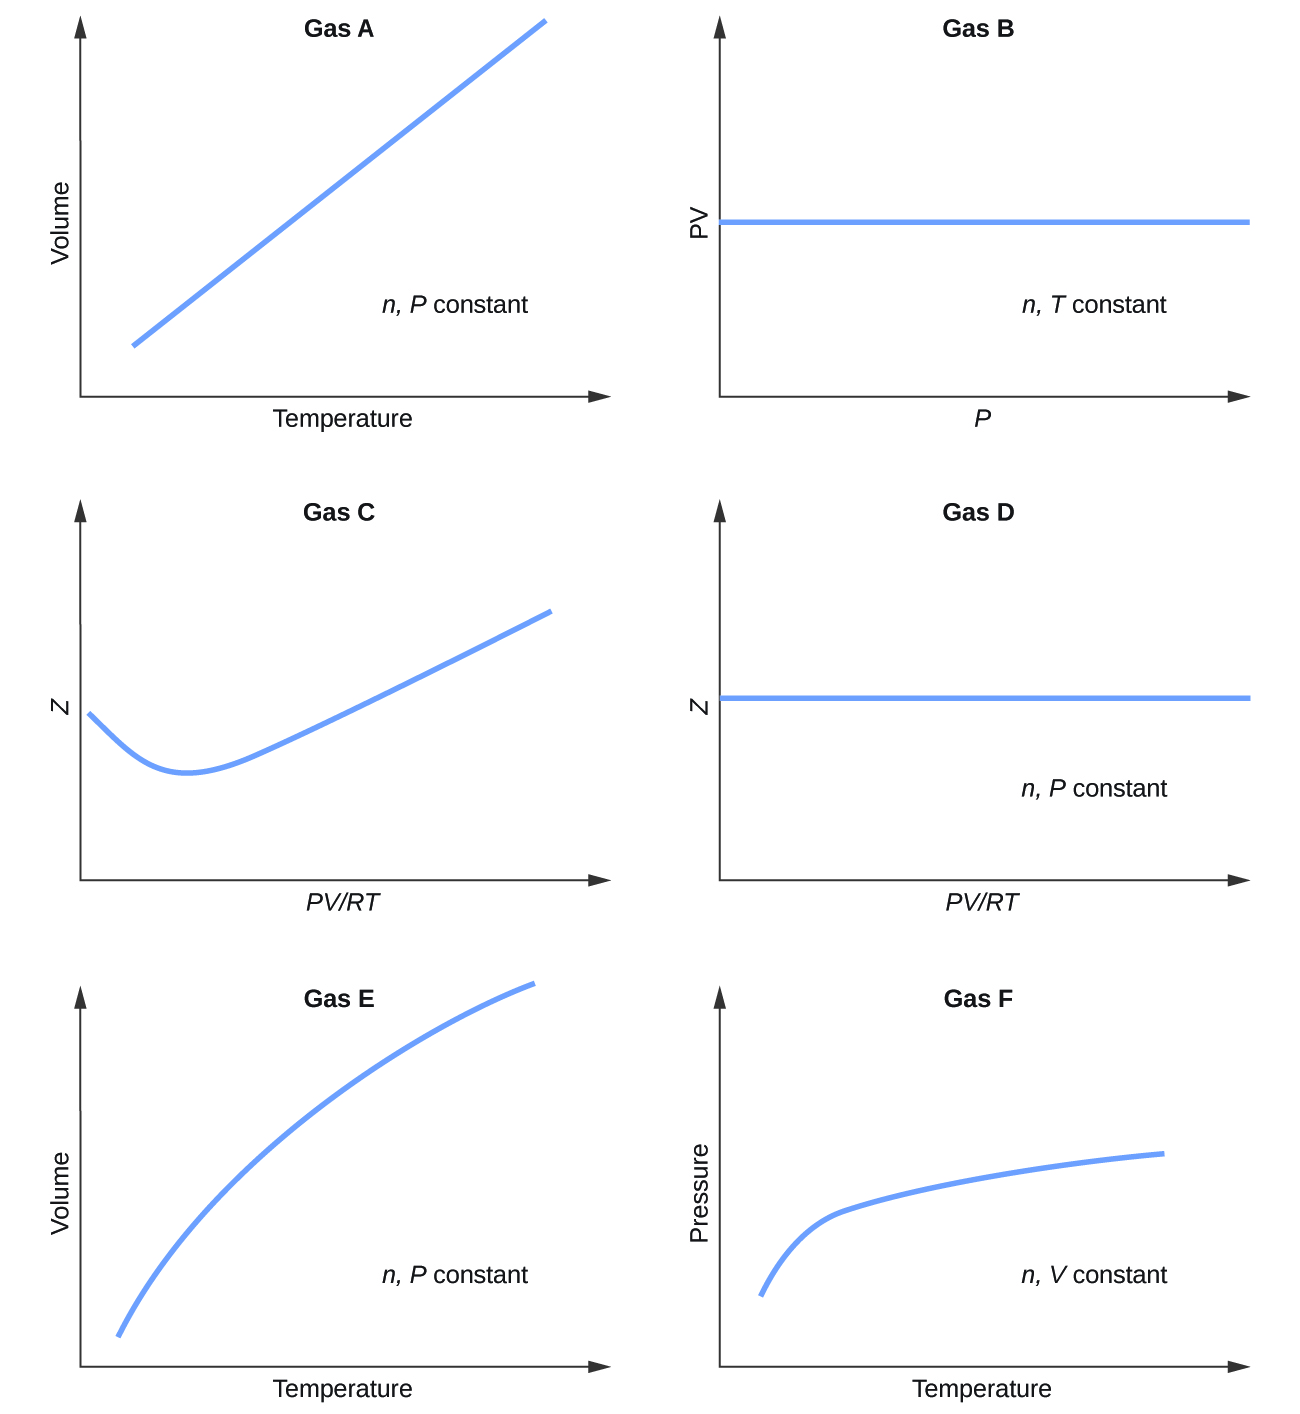
This figure includes 6 graphs. The first, which is labeled, “Gas A,” has a horizontal axis labeled, “Temperature,” and a vertical axis labeled, “Volume.” A straight blue line segment extends from the lower left to the upper right of this graph. The open area in the lower right portion of the graph contains the label, “n, P constant.” The second, which is labeled, “Gas B,” has a horizontal axis labeled, “P,” and a vertical axis labeled, “P V.” A straight blue line segment extends horizontally across the center of this graph. The open area in the lower right portion of the graph contains the label, “n, T constant.” The third, which is labeled, “Gas C,” has a horizontal axis labeled,“P V divided by R T,” and a vertical axis labeled, “Moles.” A blue curve begins about halfway up the vertical axis, dips slightly, then increases steadily to the upper right region of the graph. The fourth, which is labeled, “Gas D,” has a horizontal axis labeled, “P V divided by R T,” and a vertical axis labeled, “Moles.” A straight blue line segment extends horizontally across the center of this graph. The open area in the lower right portion of the graph contains the label “n, P constant.” The fifth, which is labeled, “Gas E,” has a horizontal axis labeled, “Temperature,” and a vertical axis labeled, “Volume.” A blue curve extends from the lower left to the upper right of this graph. The open area in the lower right portion of the graph contains the label “n, P constant.” The sixth graph, which is labeled, “Gas F,” has a horizontal axis labeled, “Temperature,” and a vertical axis labeled, “Pressure.” A blue curve begins toward the lower left region of the graph, increases at a rapid rate, then continues to increase at a relatively slow rate moving left to right across the graph. The open area in the lower right portion of the graph contains the label, “n, V constant.”

Gases C, E, and F

Got questions? Get instant answers now!

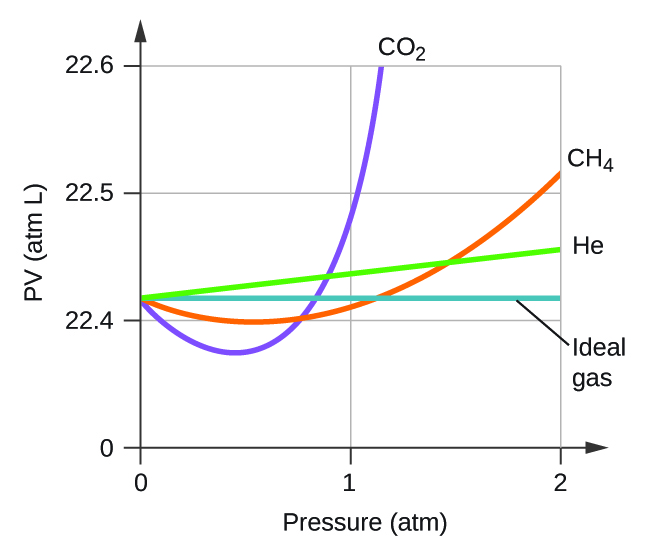
Explain why the plot of PV for CO 2 differs from that of an ideal gas.

A graph is shown. The horizontal axis is labeled, “P ( a t m ).” Its scale is marked at 0, 1, and 2. The vertical axis is labeled, “P V ( a t m L ).” This scale includes markings at 0, 22.4, 22.5, and 22.6. Two curves and two lines are drawn of varying colors. One line is a horizontal, blue line extending right from about 22.42 a t m L on the vertical axis, and is labeled, “Ideal gas.” The remaining two curves and one line start at the same point on the vertical axis. A green line extends up and to the right slightly on the graph, reaching a value of approximately 22.46 a t m L at 2 a t m. This green line is labeled, “H e.” An orange curve dips below the horizontal ideal gas line initially, then increases to cross the line just past 1 a t m. This curve reaches a value of about 22.52 a t m L at 2 a t m. This curve is labeled, “C H subscript 4.” A purple curve dips below the horizontal ideal gas line initially, then increases to cross the line at about 0.8 a t m. This curve reaches a value of nearly 22.62 a t m L at nearly 1.2 a t m. This curve is labeled, “C O subscript 2.”
Got questions? Get instant answers now!

Under which of the following sets of conditions does a real gas behave most like an ideal gas, and for which conditions is a real gas expected to deviate from ideal behavior? Explain.

(a) high pressure, small volume

(b) high temperature, low pressure

(c) low temperature, high pressure

The gas behavior most like an ideal gas will occur under the conditions in (b). Molecules have high speeds and move through greater distances between collision; they also have shorter contact times and interactions are less likely. Deviations occur with the conditions described in (a) and (c). Under conditions of (a), some gases may liquefy. Under conditions of (c), most gases will liquefy.

Got questions? Get instant answers now!

Describe the factors responsible for the deviation of the behavior of real gases from that of an

ideal gas.

Got questions? Get instant answers now!

For which of the following gases should the correction for the molecular volume be largest:

CO, CO 2 , H 2 , He, NH 3 , SF 6 ?

SF 6

Got questions? Get instant answers now!

A 0.245-L flask contains 0.467 mol CO 2 at 159 °C. Calculate the pressure:

(a) using the ideal gas law

(b) using the van der Waals equation

(c) Explain the reason for the difference.

(d) Identify which correction (that for P or V) is dominant and why.

Got questions? Get instant answers now!

Answer the following questions:

(a) If XX behaved as an ideal gas, what would its graph of Z vs. P look like?

(b) For most of this chapter, we performed calculations treating gases as ideal. Was this justified?

(c) What is the effect of the volume of gas molecules on Z? Under what conditions is this effect small? When is it large? Explain using an appropriate diagram.

(d) What is the effect of intermolecular attractions on the value of Z? Under what conditions is this effect small? When is it large? Explain using an appropriate diagram.

(e) In general, under what temperature conditions would you expect Z to have the largest deviations from the Z for an ideal gas?

(a) A straight horizontal line at 1.0; (b) When real gases are at low pressures and high temperatures they behave close enough to ideal gases that they are approximated as such, however, in some cases, we see that at a high pressure and temperature, the ideal gas approximation breaks down and is significantly different from the pressure calculated by the ideal gas equation (c) The greater the compressibility, the more the volume matters. At low pressures, the correction factor for intermolecular attractions is more significant, and the effect of the volume of the gas molecules on Z would be a small lowering compressibility. At higher pressures, the effect of the volume of the gas molecules themselves on Z would increase compressibility (see [link] ) (d) Once again, at low pressures, the effect of intermolecular attractions on Z would be more important than the correction factor for the volume of the gas molecules themselves, though perhaps still small. At higher pressures and low temperatures, the effect of intermolecular attractions would be larger. See [link] . (e) low temperatures

Got questions? Get instant answers now!

Questions & Answers

What is inflation
Bright Reply
a general and ongoing rise in the level of prices in an economy
AI-Robot
What are the factors that affect demand for a commodity
Florence Reply
differentiate between demand and supply giving examples
Lambiv Reply
differentiated between demand and supply using examples
Lambiv
what is labour ?
Lambiv
how will I do?
Venny Reply
how is the graph works?I don't fully understand
Rezat Reply
information
Eliyee
devaluation
Eliyee
t
WARKISA
hi guys good evening to all
Lambiv
multiple choice question
Aster Reply
appreciation
Eliyee
explain perfect market
Lindiwe Reply
In economics, a perfect market refers to a theoretical construct where all participants have perfect information, goods are homogenous, there are no barriers to entry or exit, and prices are determined solely by supply and demand. It's an idealized model used for analysis,
Ezea
What is ceteris paribus?
Shukri Reply
other things being equal
AI-Robot
When MP₁ becomes negative, TP start to decline. Extuples Suppose that the short-run production function of certain cut-flower firm is given by: Q=4KL-0.6K2 - 0.112 • Where is quantity of cut flower produced, I is labour input and K is fixed capital input (K-5). Determine the average product of lab
Kelo
Extuples Suppose that the short-run production function of certain cut-flower firm is given by: Q=4KL-0.6K2 - 0.112 • Where is quantity of cut flower produced, I is labour input and K is fixed capital input (K-5). Determine the average product of labour (APL) and marginal product of labour (MPL)
Kelo
yes,thank you
Shukri
Can I ask you other question?
Shukri
what is monopoly mean?
Habtamu Reply
What is different between quantity demand and demand?
Shukri Reply
Quantity demanded refers to the specific amount of a good or service that consumers are willing and able to purchase at a give price and within a specific time period. Demand, on the other hand, is a broader concept that encompasses the entire relationship between price and quantity demanded
Ezea
ok
Shukri
how do you save a country economic situation when it's falling apart
Lilia Reply
what is the difference between economic growth and development
Fiker Reply
Economic growth as an increase in the production and consumption of goods and services within an economy.but Economic development as a broader concept that encompasses not only economic growth but also social & human well being.
Shukri
production function means
Jabir
What do you think is more important to focus on when considering inequality ?
Abdisa Reply
any question about economics?
Awais Reply
sir...I just want to ask one question... Define the term contract curve? if you are free please help me to find this answer 🙏
Asui
it is a curve that we get after connecting the pareto optimal combinations of two consumers after their mutually beneficial trade offs
Awais
thank you so much 👍 sir
Asui
In economics, the contract curve refers to the set of points in an Edgeworth box diagram where both parties involved in a trade cannot be made better off without making one of them worse off. It represents the Pareto efficient allocations of goods between two individuals or entities, where neither p
Cornelius
In economics, the contract curve refers to the set of points in an Edgeworth box diagram where both parties involved in a trade cannot be made better off without making one of them worse off. It represents the Pareto efficient allocations of goods between two individuals or entities,
Cornelius
Suppose a consumer consuming two commodities X and Y has The following utility function u=X0.4 Y0.6. If the price of the X and Y are 2 and 3 respectively and income Constraint is birr 50. A,Calculate quantities of x and y which maximize utility. B,Calculate value of Lagrange multiplier. C,Calculate quantities of X and Y consumed with a given price. D,alculate optimum level of output .
Feyisa Reply
Answer
Feyisa
c
Jabir
Got questions? Join the online conversation and get instant answers!
Jobilize.com Reply
Practice Key Terms 2

Get Jobilize Job Search Mobile App in your pocket Now!

Get it on Google Play Download on the App Store Now


Source:  OpenStax, Chemistry. OpenStax CNX. May 20, 2015 Download for free at http://legacy.cnx.org/content/col11760/1.9
Google Play and the Google Play logo are trademarks of Google Inc.

Notification Switch

Would you like to follow the 'Chemistry' conversation and receive update notifications?

Ask